| This is a Draft Amnesty Week draft. I wrote this as my undergraduate thesis and haven't looked at it in depth since completing it. I'm not currently working on this topic and wasn't interested in editing it to fit the Forum better, but thought the community might find value in these ideas, and wouldn't have posted this without the nudge of Draft Amnesty Week. |
Abstract
This study introduces the Global Sociotechnological Resilience Index (GSTRI), a new method for evaluating the inherent civilizational resilience of regions based on their physical and environmental attributes. The GSTRI consists of five sub-indices representing critical sociotechnological systems: climate control, food, resource extraction, utilities, and shelter. By using granular, location-specific data and excluding socio-political factors, the GSTRI provides a foundational assessment of the capacity of different areas to support civilizational recovery after a global catastrophe. The study identified 218 high-resilience hotspots globally, with the 10 largest located in countries such as the United States, Argentina, Australia, China, South Africa, France, Russia, and Brazil. These hotspots exhibit favorable characteristics across multiple sociotechnological systems, suggesting a higher potential for sustaining human populations and fostering long-term civilizational resilience. The findings offer insights for understanding inherent resilience and informing preparedness strategies and resource allocation. Further research should aim to refine the GSTRI by incorporating expert insights, exploring alternative indices, and integrating different stages and timeframes of disruptive events. Understanding inherent resilience is essential for guiding civilizational recovery efforts and mitigating the impacts of potential global catastrophes.
Introduction
The study of civilizational resilience aims to understand how societies can withstand and recover from global calamities, such as nuclear winter, engineered pandemics, and artificial intelligence risks (Bostrom & Ćircović, 2008). Despite the sharp rise in worldwide economic prosperity and quality of life over the past few centuries, these threats jeopardize our prosperity (Baum et al., 2019). While various existential threats have been explored, research on the resilience mechanisms essential for rebounding from near-extinction events remains limited, despite its potential to significantly enhance survival and recovery chances. This study integrates theories of risk, resilience, and critical systems into a model of civilizational trajectories post-global catastrophe, enabling the exploration of sociotechnological critical systems and factors contributing to their resilience, and identifying regions on Earth with characteristics conducive to recovery. The results provide insights into how surviving populations might navigate the aftermath of global catastrophic events, with the exploration of a nuclear war scenario, and offer a strategic blueprint for future contingency planning, allowing for greater coordination and integration of governance tools to mitigate risks of civilizational collapse and human extinction.
Background
Civilizational Collapse
The study of global catastrophic risks deals with events that would inflict significant harm to humans worldwide (Bostrom & Ćircović, 2008). Thus, scholars have created various classifications of risks by examining various global spread mechanisms, affected critical systems, and prevention and mitigation efforts (Avin et al., 2018). Global spread mechanisms refer to how failures of systems propagate extensively, potentially leading to severe consequences. These catastrophic mechanisms could manifest through replicators (biological, digital, or cultural), the natural environment (astronomical, air-based dispersal, or water-based dispersal), or anthropogenic networks (communication, utilities, or commerce and transit). Global catastrophic events can spread through various global spread mechanisms due to their interlinked nature.
Analyzing the interplay between global spread mechanisms and failures of critical systems can help identify threats that may spread and endanger human populations worldwide, and systems that, if disrupted beyond a certain threshold, can significantly reduce humanity's chances of survival (Avin et al., 2018). Critical systems range from “lower-level” systems, which are directly essential for human survival, such as physical, biogeochemical, cellular, and anatomical systems, to “higher-level” systems, such as whole organism, ecological, and sociotechnological systems, which depend on the function of the “lower-level” systems and assist in preserving the current population levels and bolstering resilience. The researchers developed the critical systems to be as comprehensive and with as little overlap as possible with other critical systems.
Sociotechnological systems, the highest-level critical systems, are complexly structured institutions, technologies, and cultural mechanisms intentionally developed by humans to secure control over various systems (Beard & Torres, 2020). Sociotechnological systems, which include climate control (modifying indoor air temperature), food, health, resource extraction, security, shelter, and utilities, provide necessary functions for civilizational resilience that result in the most significant disruptions if disturbed, such as civilizational collapse or human extinction (Avin et al., 2018). Scholars have described catastrophe trajectories as one class of long-term trajectories that humanity might follow, along with status quo, technological transformation, and astronomical trajectories (space colonization) (Baum et al., 2019). Various types of collapse scenarios have been conceptualized, including societal collapse, which involves substantial and enduring reductions in factors such as human population numbers (King & Jones, 2021). Conversely, while the failure of critical systems can make societies more prone to civilizational collapse in the event of a global catastrophe, their robustness can contribute to civilizational resilience and recovery.
Civilizational Resilience
There has been a lack of research addressing civilizational resilience—the capacity to recover from a near-existential catastrophe—in the global catastrophic risk literature (Baum, 2018; Maher & Baum, 2013). Linkov and Trump (2019) distinguish the concepts of risk and resilience using a spatio-temporal model. They argue that risk analysis focuses on the planning and absorption phases, while resilience encompasses the recovery and adaptation phases. They emphasize the speed of recovery as a measure of resilience and advocate for incorporating recovery and adaptation phases into the resilience model, taking a “threat agnostic” perspective. However, Aven (2022) contests this framework, arguing that risk should also cover the recovery phase and that resilience should be viewed as part of risk analysis. This study adopts the following operationalizations of risk, vulnerability, and resilience: risk is defined as “the combination of the consequences of an activity and associated uncertainties”; vulnerability is “the combination of the consequences C and associated uncertainties given an event A”; and resilience “is an aspect of vulnerability” and is “the ability to return to the ‘normal’ state or level, that is, to sustain or restore the ‘normal’ functionality level, given an event A (even unknown)” (Aven, 2022, p. 2066). By adopting these definitions, this study acknowledges the importance of considering risk in the recovery phase and views resilience as an integral part of risk analysis.
A fast-acting global catastrophe could lead to several possible initial civilizational trajectories, which may result in outcomes such as “immediate human extinction”, “survival without agriculture and industry”, or survival with agriculture but without industry (Baum et al., 2019, p. 10). The likelihood of survival can be understood as occurring in two distinct phases: surviving the catastrophe, and subsequently surviving collapse (Belfield, 2023). Some scholars have defined successful adaptation as the ability to survive by securing basic human needs (Maher & Baum 2013). Depending on the level of recovery of these trajectories, subsequent trajectories can ensue. It is also possible that despite escaping extinction from the initial catastrophe, subsequent risks may make civilization ill-equipped to recover and could cause the permanent curtailment or extinction of humanity (Cotton-Barratt et al., 2020). Global catastrophic risks may generate latent and cascading risks, in which both the exposure and vulnerability to hazards increase in the state of a collapse (Kemp et al., 2022; Belfield, 2023). After surviving civilizational collapse, some scholars have used the term “successful recovery” to refer to the ability of society to recover a space travel program, thereby enabling the potential for space colonization (Maher & Baum, 2013). In contrast, other scholars have used the term “technical recovery” to describe a society’s capacity to regain technological capabilities and functioning comparable to present-day levels, which may encompass various outcomes in terms of overall welfare, population distribution, and political structures (Belfield, 2023).
Factors Contributing to Civilizational Resilience
The success of a society's adaptation and recovery after a catastrophe primarily depends on the specific challenges faced by the surviving populations and their ability to effectively use available resources and navigate the post-catastrophe environment (Maher & Baum, 2013). Firstly, several global catastrophic risk scenarios could feasibly cause threats to the global food supply (Baum, 2018). Hunger would likely be the first problem, followed by issues regarding the availability of existing food reserves, population sizes, and agricultural productivity (Belfield, 2023). In the immediate aftermath of a global catastrophe, people will not only require food but also water as essentials for their survival (Baum et al., 2019). Populations will then need to rely on either food reserves, farmed and wild animals, fisheries, provisions in stores and households, crops previously used for livestock feed, or develop alternative ways to grow crops, such as by using sources of non-sunlight energy (Baum, 2018; Beckstead, 2015). Specifically, grain availability may be crucial (Baum et al., 2019). Locations will then need to have self-sufficient food production to be able to sustain themselves for a lengthy period (Boyd & Wilson, 2020). The ability to either maintain or redevelop agriculture will be a significant factor for their long-term trajectory (Baum et al., 2019).
Even in catastrophes that decimate 99.9% of the human population, there still may be clusters in agriculturally productive regions that have enough survivors to recover (Belfield, 2023). However, the size of a surviving population as well as the demographic and sex distribution play an important role in their viability to continue existing (Baum et al., 2019). The concept of how large a minimally viable population would need to be has been debated, with some arguing that a fixed number cannot be set, while others have given ranges between 100 to 40,000 people (Baum et al., 2019). Without aid in the event of a natural hazard, the resilience of surviving populations might be threatened by the reduction of the population to sizes that will not be able to flourish and may exacerbate other risks, such as civil conflict, which could slow the efforts that have already been made for civilizational recovery (Boyd & Wilson, 2020). While a relatively large population may be required to retain complex technical knowledge, coordination problems and violence are more likely to result from these larger populations.
A global catastrophe could cause cascading effects for a variety of risks, including hostilities and warfare, the spread of diseases, and political and economic strife (Kemp et al., 2022). After historical small-scale collapses, such as the Black Death, there were varying responses within different societies, from cooperation to revolt and the subsequent breakdown of the local social system (Schoch-Spana et al., 2017). Threats after a global catastrophe, like shocks to the globally interconnected food system, could be mediating factors that are conducive to heightening societal risks (Kemp et al., 2022). However, societies with durable institutions, such as religion, the military, universities, businesses, and political parties, may add to the resilience of societies in the event of a collapse (Belfield, 2023).
Natural capital is also important for the resilience of surviving populations, including a hospitable climate, raw materials, and sources of energy (Belfield, 2023). While there is uncertainty about whether society could reestablish itself in the climatic conditions of the Anthropocene, since pre-modern humans developed in stable climates of the Holocene era, a hospitable climate may be important for the successful recovery of civilization (Belfield, 2023). For thousands of years, human settlements have lived in a specific global climate range, primarily within a mean annual temperature (MAT) of approximately 11°C to 15°C (Xu et al., 2020). Even today, this temperature range is where the majority of crop and livestock production occurs. Scholars have debated whether environmental factors, such as hospitable climates, or social factors were more influential determinants for the growth of civilizations (Maher & Baum, 2013). Should environmental factors prove to be paramount, then it is probable that humans situated in advantageous environments would be the ones to successfully rebuild advanced civilizations. More extreme climates can lead to challenges in food and energy production, and disease prevalence, and could inherently endanger the lives of human populations (Baum et al., 2019; Boyd & Wilson, 2021).
Sources of energy are important for populations’ resilience, as energy self-sufficiency allows for greater capabilities concerning food and technology (Boyd & Wilson, 2020, 2021). Renewable resources such as solar and wind energy can continue to be utilized, usable metals can be extracted from manmade infrastructure, including non-operational systems like power plants, and remaining fossil fuel stocks have potential for future energy needs (Baum et al., 2019; Beckstead, 2015; Belfield, 2023). Additionally, the abundance of resources allows for greater infrastructure resilience, and industrial bases facilitate the production of electronics conducive to technical recovery (Boyd & Wilson, 2020; Boyd & Wilson, 2021). Historically, the development of civilization was limited by the dependence on natural energy sources and the exploitation of physical labor, and the exponential growth in development over the past couple of centuries can be largely attributed to the excess energy provided by sources with a high return on investment (King & Jones, 2021). The vulnerability and resilience of regions for civilizational recovery may therefore be dependent on proximity to energy sources, which are not evenly distributed globally. Effective recovery of civilization may require populations to have the capacity to migrate to areas with abundant resources, utilize those resources, and subsequently increase their population numbers (Boyd & Wilson, 2020).
Current Attempts to Assess Civilizational Resilience
Collapse Lifeboats
Several scholars have explored regions, sometimes referred to as “collapse lifeboats”, that may not experience the most disastrous effects of civilizational collapse and could feasibly retain substantial population levels (King & Jones, 2021). For scenarios involving catastrophic pandemics and abrupt sunlight-reducing catastrophes, such as a nuclear winter, researchers have examined the characteristics of island nations to assess the potential to turn them into civilizational refuges, with Australia, New Zealand, and Iceland being the three highest-ranked island nations that contained features optimal for a refuge in all of their studies (Boyd & Wilson, 2020, 2021, 2023). Island nations were chosen because of their greater ability to isolate more effectively to avoid exposure to a pandemic. While existing natural refuges, such as uncontacted tribes, have sustained themselves until now, they are less likely to support a technical recovery of civilization due to their lack of technological capabilities, limited ability to sustain large populations over prolonged periods, and smaller human populations. As a result, the scale developed by Boyd and Wilson (2020) focuses on island nations with characteristics that are more conducive to resilience and recovery. Twenty-five optimal features for refuges were identified, which were then categorized into four themes: population, location, resources, and society. The variables for each feature were normalized to a scale from 0 to 1, with the highest scoring island for a given metric setting the scale’s maximum at 1 or 0, depending on whether a higher or lower score indicated a better outcome. An average score was then calculated for each island across all variables, and the islands were subsequently ranked based on this score. For instances where data were missing, the average score was computed using the remaining indicators for those islands.
The researchers also attempted to evaluate and prioritize island nations in the event of an abrupt sunlight-reducing scenario (Boyd & Wilson, 2023). A threshold analysis was conducted to assess the capacity for self-sustaining food production in a nuclear winter scenario. The researchers used previously created models that projected crop yields and marine fisheries for most nations under different nuclear winter scenarios, with atmospheric soot levels ranging from 5 to 150 teragrams (Tg) (Xia et al., 2022). Dietary energy production (DEP) capacities were then calculated for every island nation researched in the previous model, and nations with a negative baseline DEP balance of below 2,200 kilocalories per capita per day were removed as candidates for island refuges. Subsequently, a literature review identified thirteen key factors that could enhance the resilience of island nations, one of which included the capacity for food self-sufficiency under a 150 teragram atmospheric soot scenario. Eight island nations were ranked within each of these domains based on their performance. For the remaining island nations, an average rank was calculated across all domains according to their overall resilience. Finally, the researchers provided an in-depth case study of New Zealand to explore ways the island nation could bolster its resilience to aid in the technical recovery of civilization.
Nodes of Persisting Complexity
Unlike research focused on “collapse lifeboats,” which targets areas to be preserved as safe havens, other studies identify geographic locations that could naturally maintain a higher degree of complexity and resilience due to favorable starting conditions (King & Jones, 2021). These scholars describe “de-complexification” as either a sudden or gradual decrease in key aspects like energy consumption, interconnectedness, and economic growth, potentially reducing societal complexity worldwide. The areas that are likely to maintain complexity throughout and beyond this process are referred to as “nodes of persisting complexity”. Identifying “nodes of persisting complexity” involved integrating the ND-GAIN (University of Notre Dame Global Adaptation Index), which ranks countries based on their vulnerability to environmental change and readiness to adapt (Chen et al., 2015), with additional de-complexification criteria such as carrying capacity, isolation, and self-sufficiency (King & Jones, 2021). The carrying capacity analysis determined if a nation’s arable land could support its population without major food imports, the isolation analysis assessed a nation’s geographical connections and proximity to large populations at risk of displacement, considering the impact on carrying capacity, and the self-sufficiency analysis evaluated a nation’s ability to endure global supply chain disruptions by examining local energy and manufacturing resources. A shortlist of the 20 least vulnerable countries was created using ND-GAIN, and a semi-quantitative method was applied to evaluate their recovery prospects in a “de-complexification” event. The top five nations (“New Zealand, Iceland, the United Kingdom, Australia, and Ireland”) were further examined qualitatively for their local energy and agricultural capacities (King & Jones, 2021, p. 1). The researchers acknowledged the simplicity of their high-level approach, recognizing the limitations of quantitative predictions in complex system behaviors typical of “de-complexification”. They argue that a macro-scale qualitative analysis is better suited to identify potential “nodes of persisting complexity” that could enhance resilience for countries with both favorable and less advantageous starting conditions.
Research Gap and Objectives
Previous studies have assessed civilizational resilience at the country level, overlooking the potential of specific regions or locations to exhibit resilience. Scholars have acknowledged these limitations and called for more granular research on subnational islands and regions (Boyd & Wilson, 2023). This study addresses this gap by proposing an assessment of the inherent resilience of locations based on their physical and environmental characteristics, independent of current social or institutional factors. By omitting socio-political variables, this approach focuses on the conditions of regions that may be more stable over time, as institutions and populations are prone to more rapid and less predictable change. While this method may not fully capture complex interactions between important factors, it provides a foundational assessment of locations’ inherent capacity to support civilizational recovery. Identifying locations with inherent features conducive to resilience could inform future migration patterns and adaptation strategies in the aftermath of a global catastrophe. The central question guiding this study is: Which specific locations on Earth possess the physical and environmental characteristics capable of facilitating a higher probability of civilizational recovery for surviving populations in the aftermath of a global catastrophe, based on data reflecting the closest approximation to present-day conditions? Additionally, this study will explore the heterogeneous effects a nuclear war could have on the resilience of different regions to contextualize the results within a particular global catastrophic scenario.
Methods
This study modifies the resilience matrix framework by Linkov and Trump (2019) to evaluate the inherent resilience of critical systems before, during, and after a global catastrophe. The original matrix assesses four resilience domains (physical, information, cognitive, and social) and four disruptive event stages (prepare, absorb, recover, adapt). However, this study’s analysis specifically concentrates on the “recover” stage, which includes short- and long-term recovery aspects such as survival, agriculture, and industry recovery. The study defines the beginning of recovery as the end of the catastrophe’s spread, and full recovery as the capability to develop a space program (Maher & Baum, 2013). The exclusion of the prepare and absorb stages, which deal with risk and initial impact, and the adapt stage, which involves uncertain long-term outcomes, centers the analysis on regions’ inherent resilience after a catastrophe, while ignoring socio-political dimensions and specific global spread mechanisms (Avin et al., 2020). This threat-agnostic approach allows for a more comprehensive evaluation of the complexity and interconnectedness of critical systems that could lead to civilizational collapse (Belfield, 2023).
Table 1. Civilizational Sociotechnological Resilience Matrix
| Prepare | Absorb | Recover | Adapt | Resilience level per critical system | |||
|---|---|---|---|---|---|---|---|
| Survive | Recover agriculture | Recover industry | |||||
| Climate control | – | – | X | X | X | – | X |
| Food | – | – | X | X | X | – | X |
| Health | – | – | – | – | – | – | – |
| Resource extraction | – | – | X | X | X | – | X |
| Security | – | – | – | – | – | – | – |
| Shelter | – | – | X | X | X | – | X |
| Utilities | – | – | X | X | X | – | X |
| Resilience level per stage | – | – | X | X | X | – | – |
Note. The matrix represents the intersection of disruptive event stages (x-axis) and sociotechnological critical systems (y-axis) during a global catastrophe. This study focuses solely on the recovery stage and does not separately calculate its sub-stages. The resilience level per critical system is represented by the different sub-indices used in the study. Cells marked with an “X” indicate the values calculated in this study.
To assess the inherent resilience of locations based on their physical and environmental characteristics, the Global Sociotechnological Resilience Index (GSTRI) was developed. The GSTRI is composed of five sub-indices, each representing a sociotechnological critical system: the Climate Suitability Index, the Caloric Suitability Index, the Development Potential Index, the Water Scarcity Index, and the Natural Hazard Index (Table 2).
Table 2. Datasets Used for the GSTRI Sub-Indices
| Dataset | Critical System | Souce | Time | Index |
|---|---|---|---|---|
| Human climate niche | Climate control | Xu et al., 2020; Xu et al., 2021 | 2020 | Climate Suitability Index |
| Maximum potential caloric yield attainable | Food | Galor & Özak, 2016 | 1500–present | Caloric Suitability Index |
| Cumulative development potential | Resource extraction | Oakleaf et al., 2019; Kennedy et al., 2023 | 2019 | Development Potential Index |
| Land distance to fresh water | Utilities | Kummu et al., 2011 | 2011 | Water Scarcity Index |
| Multihazard frequency and distribution | Shelter | Dilley et al., 2005; Center For Hazards and Risk Research, 2005 | 2000 | Natural Hazard Index |
Note. For additional information regarding the datasets, refer to Appendix A.
Included Indicators
Climate Control
Researchers have previously identified temperate oceanic zones as having favorable conditions for stability in catastrophic events due to their consistent temperature and precipitation (King & Jones, 2021). While other studies have incorporated country-level climate vulnerability indices focusing on extreme risks, a global dataset correlating human population distribution with an optimal mean annual temperature range of 11°C to 15°C has been used to pinpoint regions best suited for human habitation (Xu et al., 2020).
Food
Previous research has examined the carrying capacity of countries using measures such as the total area of arable land per capita (King & Jones, 2021). However, this approach does not account for the varying caloric returns of different arable lands. While some studies have assessed the food energy production per capita of countries in kilocalories (Boyd and Wilson, 2020, 2021, 2023), this study assesses the potential crop yield using a 5’ by 5’ cell size and estimates the maximum potential annual caloric production per hectare based on the inherent biophysical capacity of the land (Galor and Özak, 2016). This approach recognizes that among arable lands, there is significant variation in the potential to produce high-calorie crops due to factors such as soil quality, climate, and topography.
Resource Extraction
In addition to local food self-sufficiency, GDP per capita has been used as a proxy for resource availability and the ratio of local energy production to total energy needs in terajoules as a metric for energy self-sufficiency (Boyd & Wilson, 2020, 2021). However, these measures might not be as relevant in a collapse scenario. To assess resilience against disruptions in the global supply chain, other researchers have evaluated countries’ local energy sources and potential manufacturing capabilities, assigning subjective scores on a scale from 1 to 5 (King & Jones, 2021). For a more detailed analysis of resource availability and development potential, this study utilizes a cumulative index created by summing the normalized Development Potential Indices (DPIs) for 13 sectors, including various mining and energy sources (e.g., solar, wind, oil, and gas) (Kennedy et al., 2023; Oakleaf et al., 2019). The DPIs focus on physical factors such as resource availability, terrain, and accessibility, rather than reflecting current local or regional technical capacities or existing infrastructure. By considering these physical factors, the cumulative index provides an overall measure of the development potential across multiple sectors in a given location.
Utilities
Utilities may encompass various indicators such as energy and water supply and distribution (Avin et al., 2018). Since cumulative DPI measure has already evaluated energy, water will be measured for this critical system. At the country-wide level, scholars have used a ranked list of countries by their access to reliable drinking water as well as freshwater withdrawal rates (King & Jones, 2021). To assess the availability of freshwater more precisely, this study will utilize the distance to freshwater sources, including lakes and rivers of various sizes, from each one-kilometer grid-cell across the world (Kummu et al., 2011). This raster file depicts the Euclidean distance to these bodies of freshwater mapped at a detailed resolution of 30 arc-seconds, which will serve as an indicator for evaluating this critical system.
Shelter
Refuge research has employed country-level risk indices to assess natural hazards, ranking countries by exposure risk and adaptive capacities (Boyd & Wilson, 2020, 2021). However, this approach has limitations, including insufficient attention to specific hazards such as volcanic eruptions and long-term threats. Other indices, like ND-GAIN, incorporate factors like sea level rise projections, populations in low-lying areas, and disaster preparedness (Chen et al., 2015). To address these limitations and provide a more comprehensive assessment of natural hazards, this study utilizes the Global Multihazard Frequency and Distribution dataset, which provides a grid of hazard deciles for cyclones, droughts, earthquakes, floods, landslides, and volcanoes at a higher spatial resolution (Dilley et al., 2005). Despite the dataset being two decades old and possibly not reflecting recent environmental changes, no newer data sources that were as comprehensive and available were found.
Excluded Indicators
Security
In the context of civilizational recovery, scholars have conceptualized security as a concept encompassing both geographic factors, such as remoteness (King & Jones, 2021), and social factors, including defense capabilities, political stability, and levels of violence (Boyd & Wilson, 2020, 2021, 2023). King and Jones (2021) conducted an isolation analysis that qualitatively assessed the proximity and ease of access of potential refuge locations to population centers, considering the implications for external populations seeking to migrate to these areas. The rationale is that easily accessible locations or those near densely populated areas may be more desirable destinations for large-scale migrations, which could in turn negatively affect the carrying capacity of these “lifeboats”. Other scholars assessed security through a political stability index, which ranks countries by the probability of political unrest and/or violence, such as terrorism (Boyd & Wilson, 2020, 2021). Defense capabilities, which can be instrumental in preserving societal order through measures like resource rationing, have been evaluated based on the military spending of countries (Boyd & Wilson, 2023). However, as this study aims to control for the inherent physical and environmental characteristics of locations rather than relying on existing populations and institutions for its indices and metrics, the critical system of security will not be included in the GSTRI.
Health
Health security indices, which reflect population health and resource availability (Avin et al., 2018), effectively measure a civilization’s initial response to catastrophes but may be less useful for assessing post-catastrophe recovery. The GSTRI’s included indicators already account for many health-related outcomes, including a hospitable and safe environment, and access to adequate food, water, and resources. Additionally, using minimum viable population as a health metric is problematic due to inconsistent evidence about the necessary and optimal population sizes for recovery (Boyd & Wilson, 2020; King & Jones, 2021). Given the lack of consensus on optimal population sizes and the implicit inclusion of health-related outcomes in the other included indicators in the GSTRI, health security indices and minimum viable population are not included as separate metrics in this study.
Cumulative Index
To create the GSTRI, the five raster datasets (Table 2) were imported into Quantum Geographic Information Systems version 3.36.1 (QGIS.org, 2024). All datasets were reprojected to match the EPSG:4326 coordinate system. The continuous values for each dataset, except for the Development Potential Index, were classified into six relative potential classes: very low, low, medium-low, medium-high, high, and very high (Table 3). These classes were created by calculating percentiles (10, 25, 50, 75, 90, and 100) for each dataset using the r.quantile tool in QGIS, excluding pixels with a value of zero to avoid skewing the distribution (GRASS Development Team, 2023). The resulting breakpoints were used to reclassify each dataset into the six classes using the “reclassify by table” tool, creating a consistent classification scheme across all datasets, except for the Development Potential Index (the dataset was already provided with this classification). This classification approach has been used in other global threat analyses (Oakleaf et al., 2019).
Table 3. Classes of the GSTRI and Sub-Indices
| Index Class | Percentile Range |
|---|---|
| Very high | > 90th percentile |
| High | 75th – 90th percentile |
| Medium-high | 50th – 75th percentile |
| Medium-low | 25th – 50th percentile |
| Low | 10th – 25th percentile |
| Very low | ≤ 10th percentile |
Note. Percentile ranges for each class of the cumulative GSTRI and its sub-indices are shown.
The reclassified datasets were assigned scores ranging from one to six, with higher scores indicating greater resilience. For the Water Scarcity Index and the Natural Hazard Index, the scores were inverted, as higher values in these datasets indicate lower resilience. After the index classes were created, the previously excluded values of 0 were reincorporated into the very low index class for the Climate Suitability Index, the Caloric Suitability Index, and the Development Potential Index, and the very high index class for the Water Scarcity Index and the Natural Hazard Index (Table 4). The cumulative GSTRI was created by summing the reclassified datasets using the Raster Calculator tool in QGIS (Equation 1). Additionally, to assess the correlations between the GSTRI and the sub-indices, a covariance matrix was calculated using the r.covar tool (GRASS Development Team, 2023).
(1)
Table 4. Ranges of the GSTRI Sub-Index Classes
| Index Class | Percentile Range | Climate Suitability Index | Caloric Suitability Index | Water Scarcity Index | Natural Hazard Index |
|---|---|---|---|---|---|
| Very low | ≤ 10th percentile | 3e-6 | 2,400.6 | 1,414.2 | 44.0 |
| Low | 10th – 25th percentile | 1e-2 | 4,078.2 | 2,828.4 | 65.0 |
| Medium-low | 25th – 50th percentile | 0.5 | 8,078.4 | 7,810.3 | 149.0 |
| Medium-high | 50th – 75th percentile | 0.8 | 10,851.5 | 340,651.6 | 212.0 |
| High | 75th – 90th percentile | 1.0 | 13,037.8 | 2,859,002.0 | 1,357.0 |
| Very high | > 90th percentile | 1.3 | 19,454.5 | 4,460,440.0 | 4,676.0 |
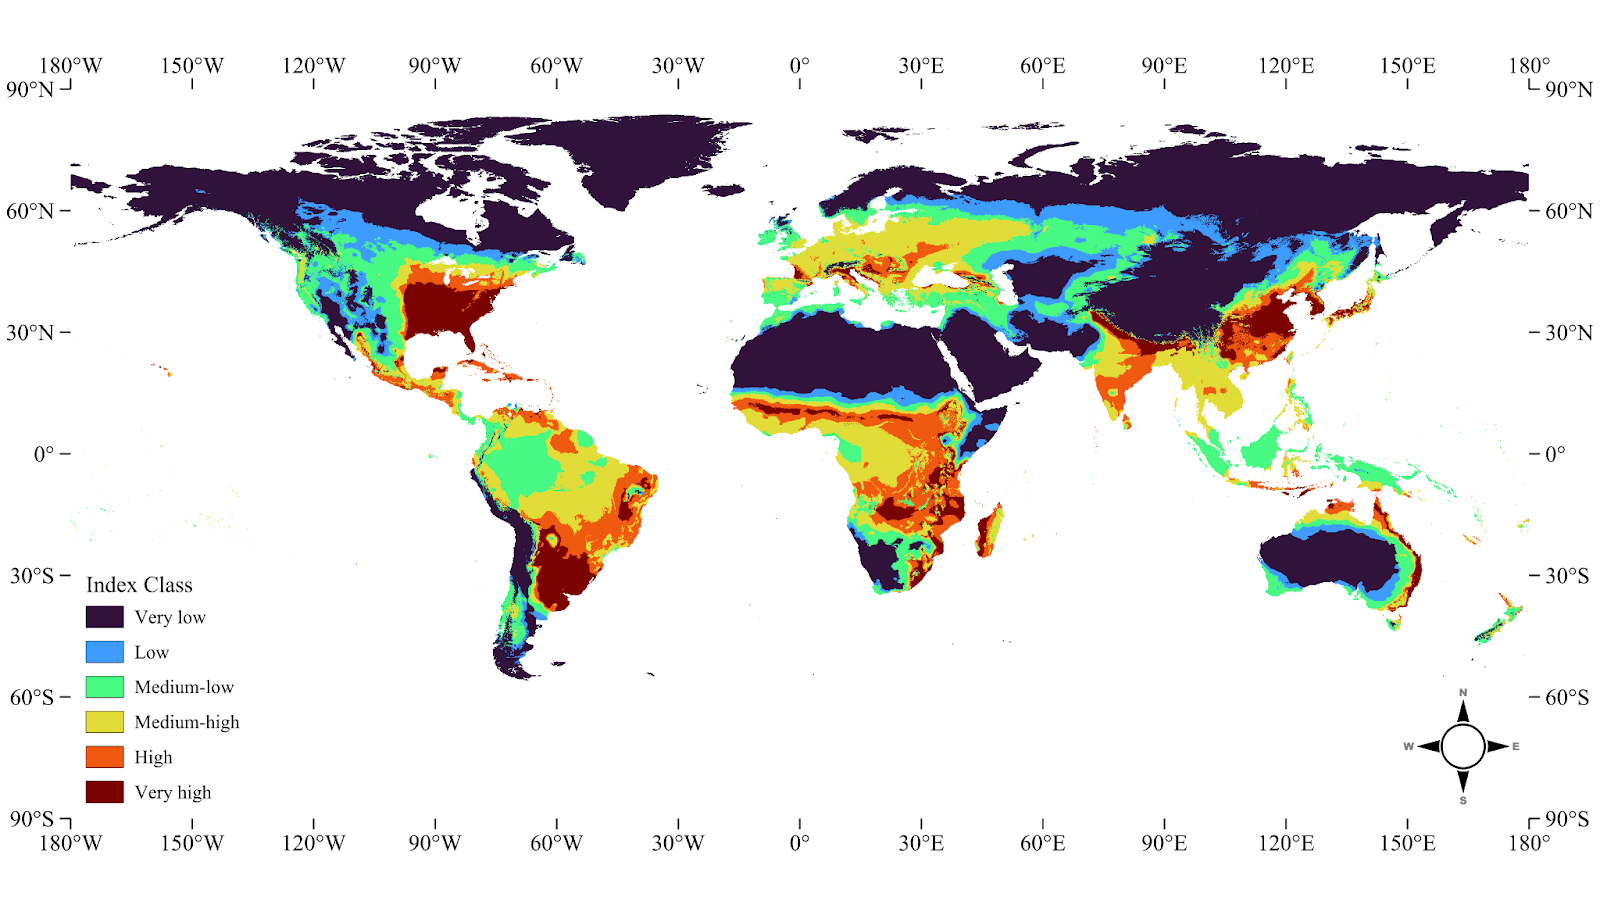
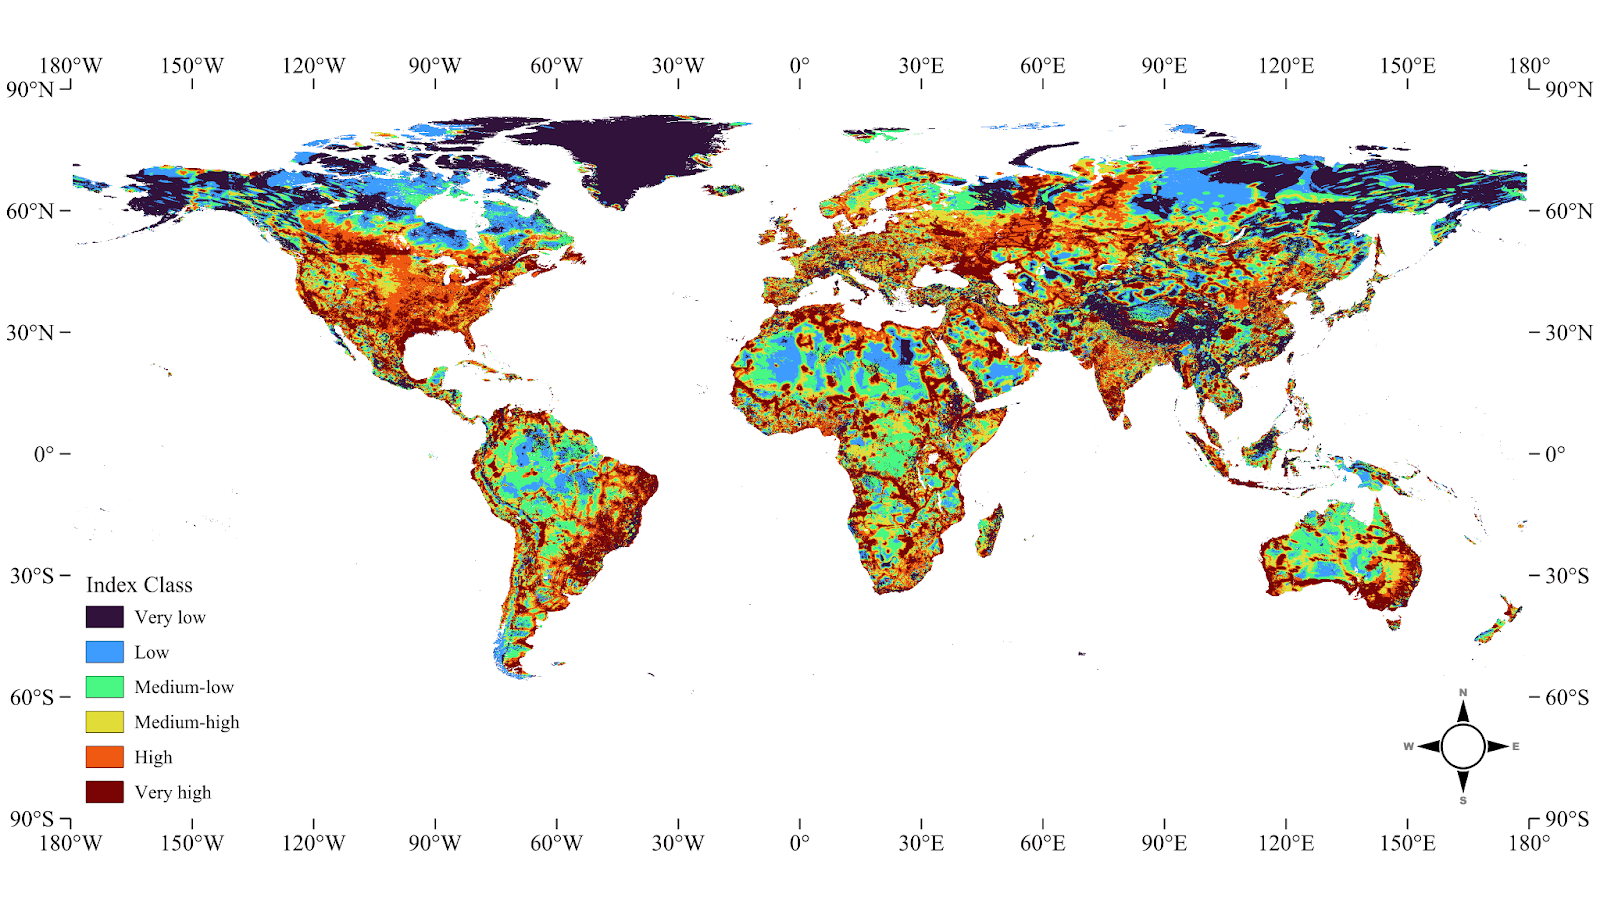
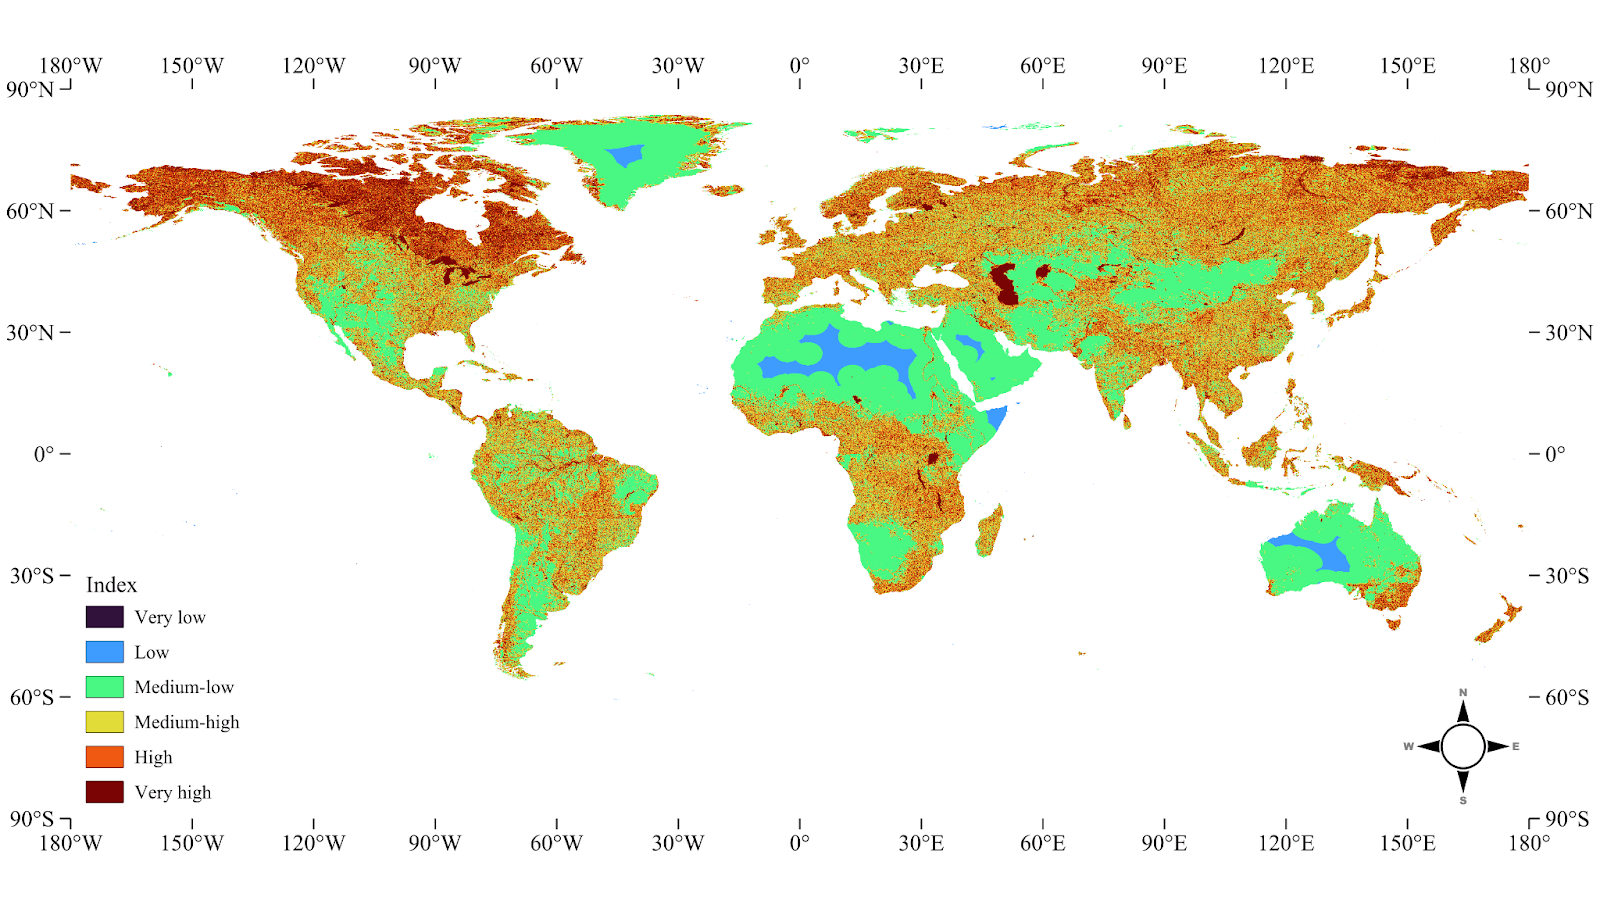
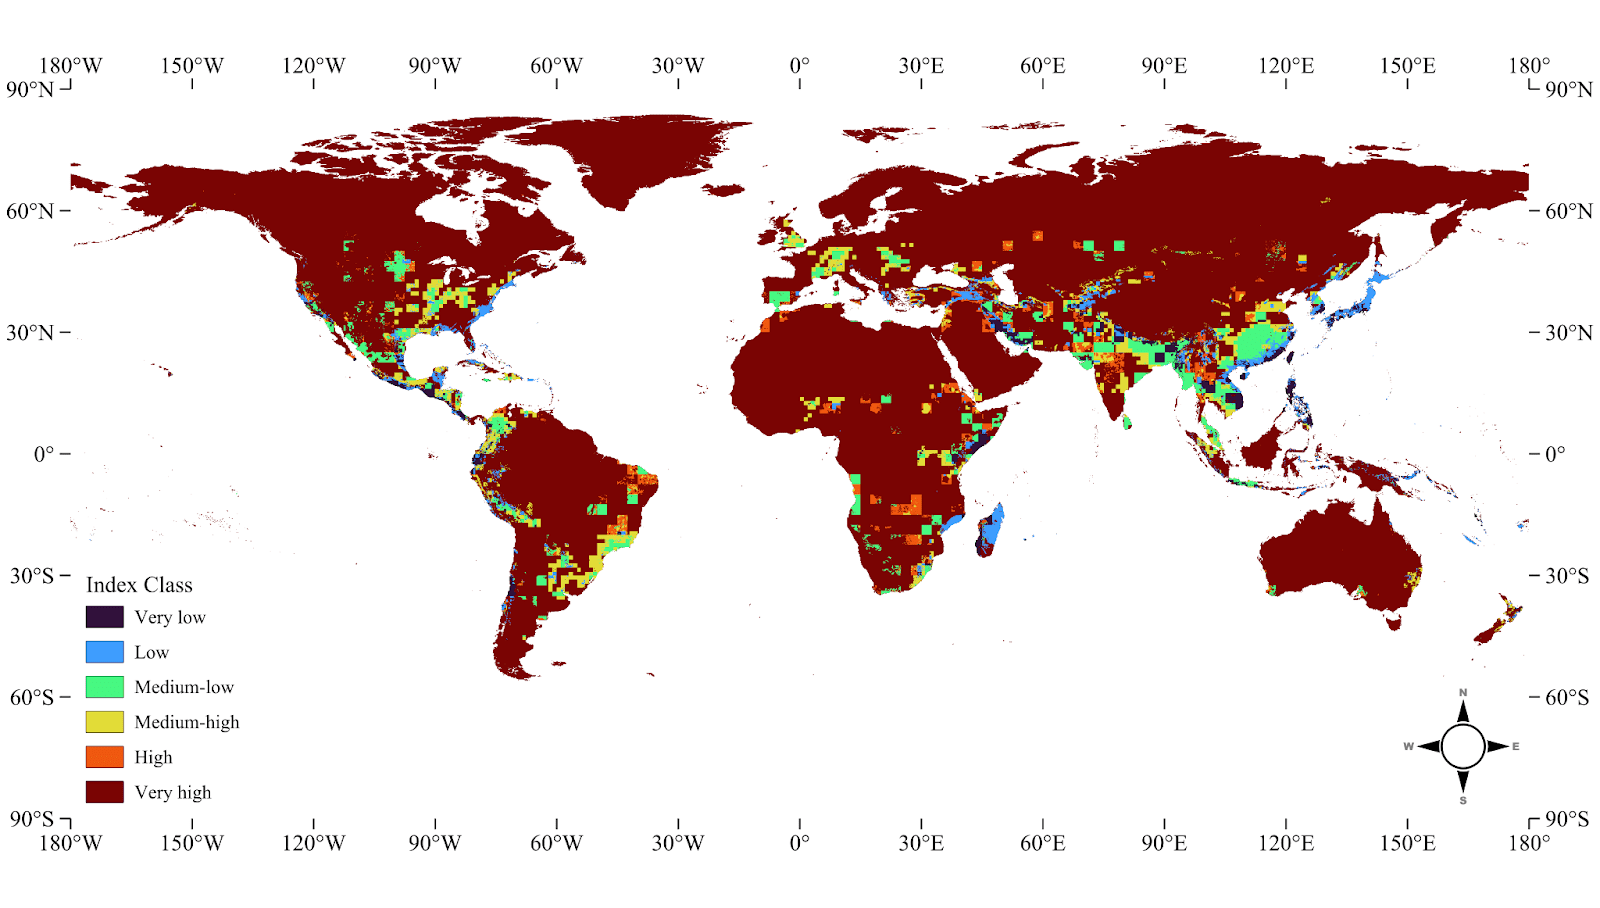
Note. Calculated breakpoints for the classes of each GSTRI sub-index are depicted. The Development Potential Index is not included because its dataset was already categorized into classes along the same percentile ranges. The colors depicted on the left-hand bar represent the color scheme subsequently used in maps of the GSTRI and the sub-indices (Figure 3, Appendix B).
Since the input layers had different resolutions (Appendix A), the datasets were automatically resampled to a common resolution of 300 arc-seconds using the nearest neighbor algorithm. The resulting GSTRI raster was resampled to a resolution of 1,800 arc-seconds for both horizontal and vertical dimensions to reduce computational intensity. The resampled raster was then converted to polygons using the “raster pixels to polygons” tool, resulting in 60,514 pixels for the spatial autocorrelation analysis. Spatial autocorrelation analysis was performed using GeoDa (Anselin et al., 2006) to identify statistically significant clusters of high and low resilience. Since there is the potential for critical p-values to become unreasonably low for a high n (Ord & Getis, 1995), a p-value threshold of 0.00001 was chosen for this analysis due to the large number of polygons (n = 60,514). A queen contiguity weights matrix was created, and Moran’s I statistic was calculated to assess the overall spatial autocorrelation. The Getis-Ord Gi* statistic was computed with 99,999 permutations, the maximum supported by GeoDa, to identify local clusters of high and low values.
Results
This study aimed to identify specific locations on Earth that possess the physical and environmental characteristics capable of facilitating a higher probability of civilizational recovery for surviving populations in the aftermath of a global catastrophe. The GSTRI index, composed of five sub-indices representing key sociotechnological critical systems, provides a novel approach to assessing inherent resilience at a granular level. Spatial autocorrelation tests reveal a strong tendency towards clustering of GSTRI data values (Figure 1), confirmed by a high positive Moran’s I (0.832, p < 0.00001). Thus, locations with similar levels of resilience are geographically clustered rather than randomly distributed.
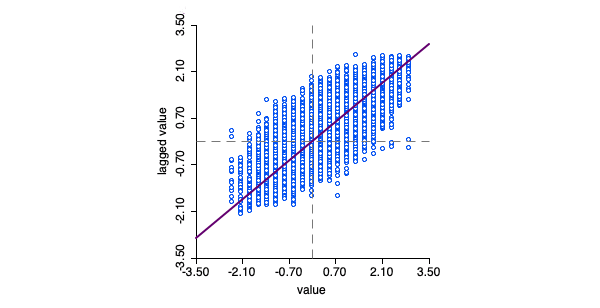
Note. This scatterplot visualizes the spatial autocorrelation of the GSTRI data. Each point represents one polygon in the resampled GSTRI, and the bivariate linear regression is indicated by the purple line. Isolated polygons were removed from the analysis to focus on the clustering patterns of contiguous polygons.
The covariance matrix shows the correlations between the GSTRI and its sub-indices (Figure 2). The Climate Suitability Index, Caloric Suitability Index, and Development Potential Index have moderate positive correlations with the GSTRI, meaning that higher scores on these sub-indices tend to be associated with higher overall resilience scores. However, the Water Scarcity Index and the Natural Hazard Index consistently lack correlations with the GSTRI and its sub-indices, besides a weak correlation between the Natural Hazard Index and the Caloric Suitability Index. The moderate positive correlation between the Climate Suitability Index and the Caloric Suitability Index (r = 0.56) suggests that areas with favorable climates may also have higher potential for agricultural and caloric productivity.
| GSTRI | 1.00 | |||||
| Climate Suitability Index | 0.70 | 1.00 | ||||
| Caloric Suitability Index | 0.76 | 0.56 | 1.00 | |||
| Development Potential Index | 0.70 | 0.45 | 0.38 | 1.00 | ||
| Water Scarcity Index | 0.20 | -0.21 | 0.08 | -0.07 | 1.00 | |
| Natural Hazard Index | -0.05 | -0.27 | -0.33 | -0.12 | -0.03 | 1.00 |
| GSTRI | Climate Suitability Index | Caloric Suitability Index | Development Potential Index | Water Scarcity Index | Natural Hazard Index |
Figure 2. Covariance Matrix for the GSTRI and Sub-Indices
Note. Cells display the correlation (r) of each pair of variables, color-coded by their strength: strong (1 to 0.8 or -0.8 to -1) is red, moderate (0.8 to 0.5 or -0.5 to -0.8) is orange, weak (0.5 to 0.3 or -0.3 to -0.5) is yellow, and no correlation (0.3 to 0 or 0 to -0.3) is green.
This GSTRI map visualizes the global distribution of the GSTRI scores, which range from very low to very high resilience (Figure 3). Regions with a very high score on the GSTRI index were found on all continents, excluding Antarctica. The color-coded representation helps to quickly identify areas with high potential for civilizational resilience post-catastrophe. It is notable that regions such as the eastern United States, much of South America and Europe, Sub-Saharan Africa, India, Eastern China, Australia, and the United States show higher resilience scores. In contrast, vast regions like Greenland, Siberia, and the Sahara Desert exhibit lower scores.
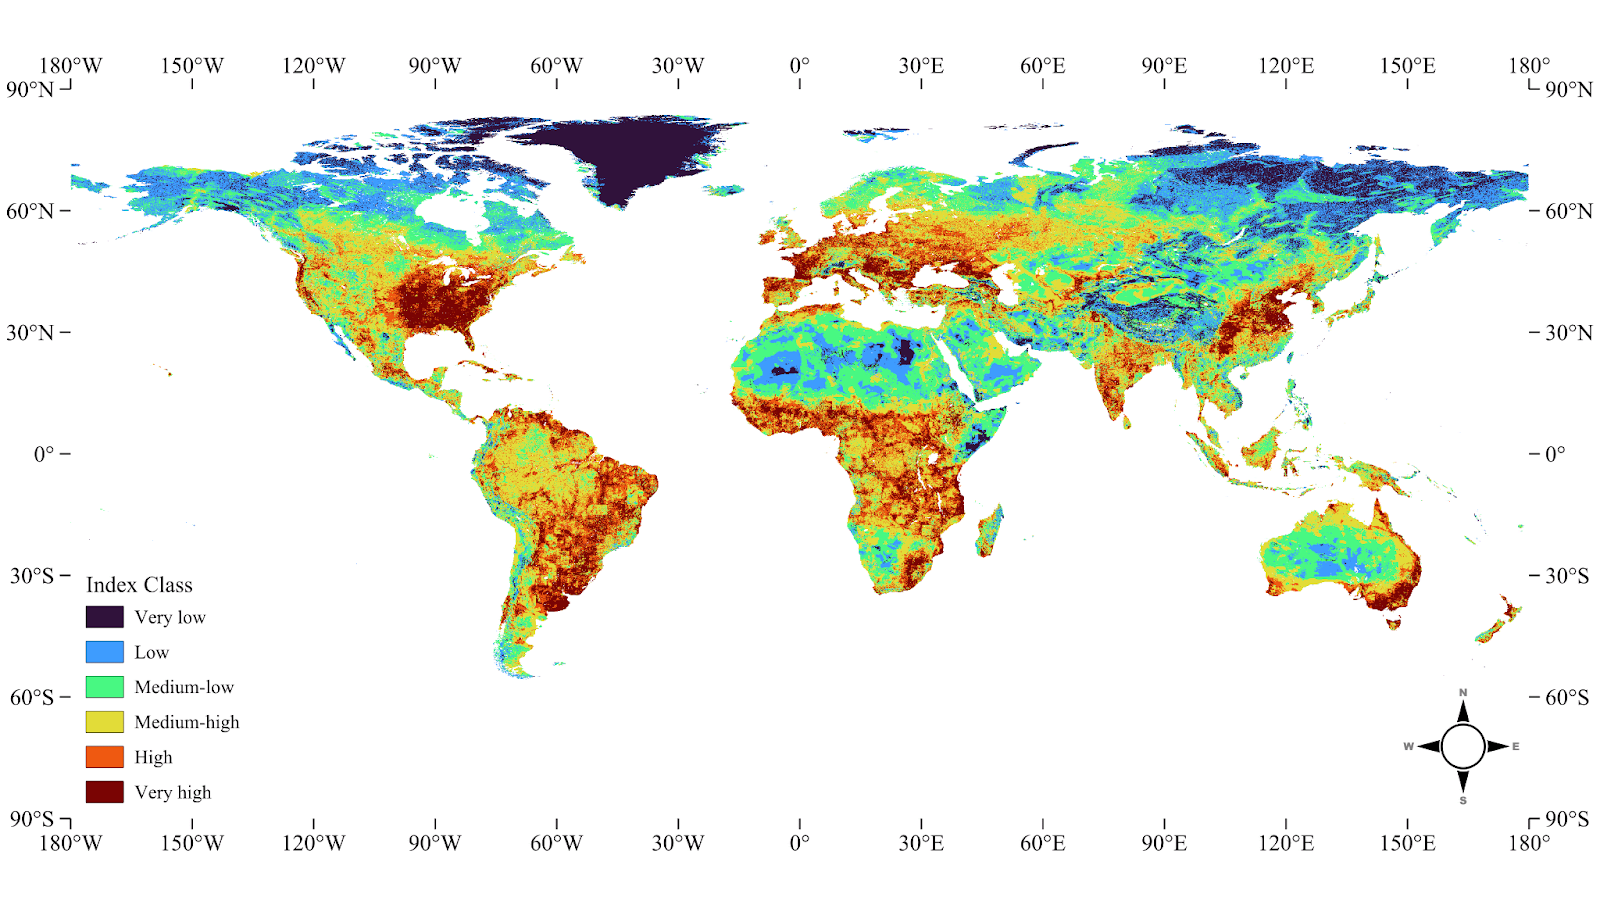
Note. The color scale ranges from blue to red, with bluer areas indicating lower resilience and redder areas indicating higher resilience.
The hotspot analysis identified 218 distinct regions globally where high resilience is statistically significant and clustered (Figure 4). These hotspots, representing contiguous areas of high resilience, illustrate regions where sociotechnological critical systems are robust enough to potentially sustain and support human populations through catastrophic global scenarios.
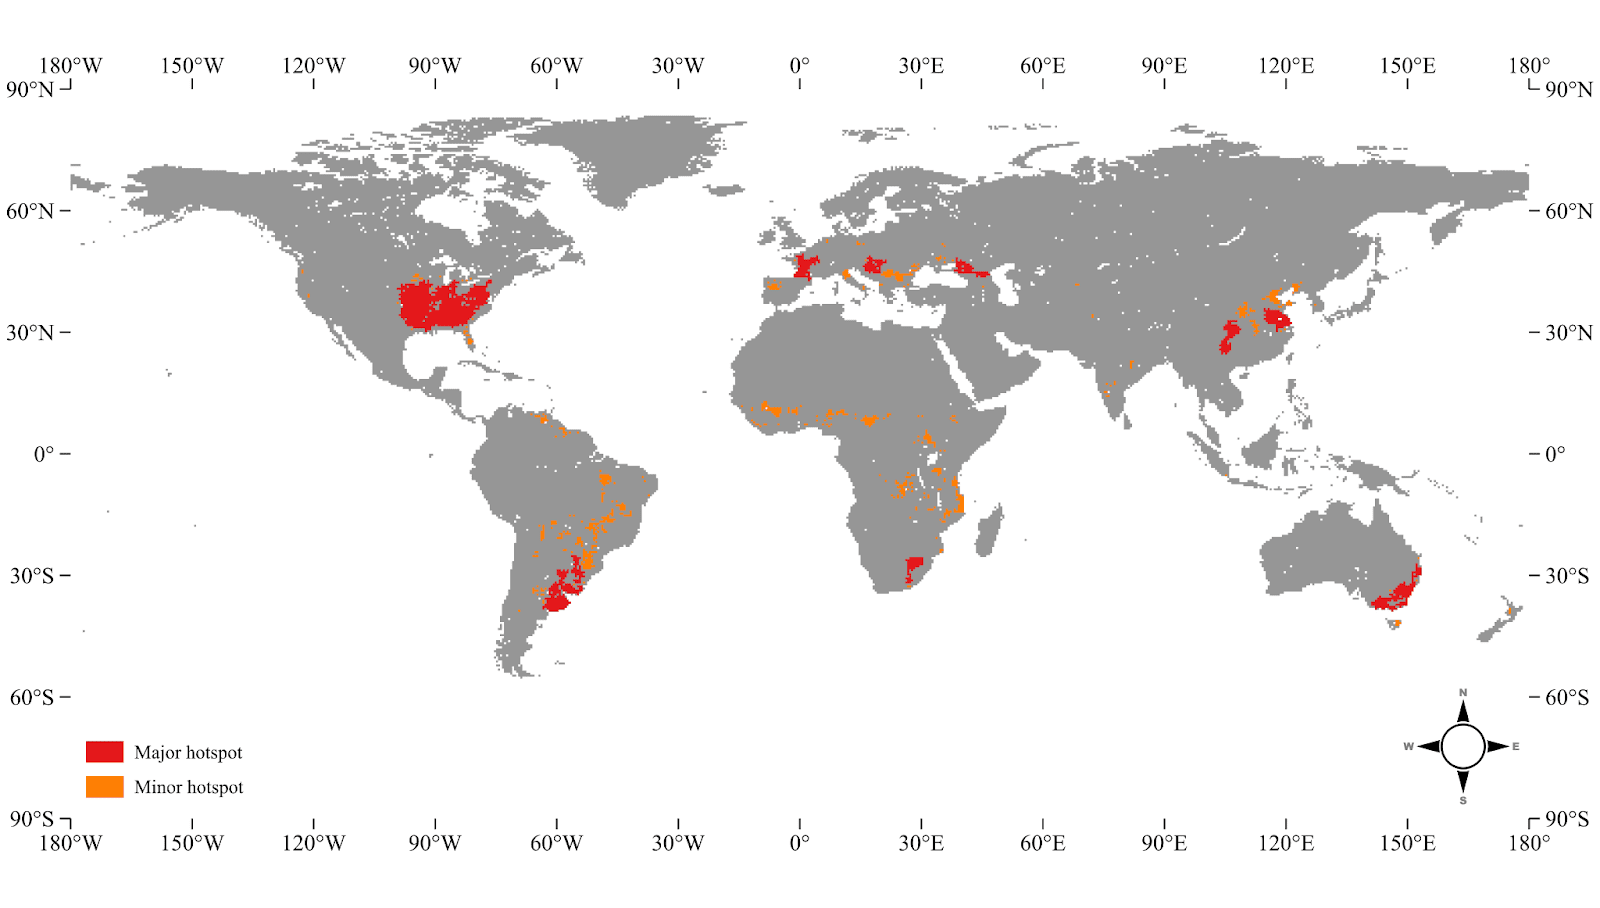
Note. This map shows statistically significant hotspots of high resilience based on the Gi* statistic at a significance level of p < 0.00001. Coldspots (areas of low resilience) were excluded from this map. The 10 largest contiguous high-resilience hotspots are considered major hotspots (Table 5).
The 10 largest hotspots (Table 5), which could potentially support larger populations and thus contribute to long-term civilizational resilience, were found in the following present-day countries: the United States, Argentina, Uruguay, Australia, China, France, South Africa, Russia, Ukraine, Brazil, Paraguay, Hungary, Croatia, Slovakia, Bosnia and Herzegovina, Czechia, Serbia, Slovenia, and Austria. These hotspots cover several major urban centers, including Washington D.C., Atlanta, Buenos Aires, Johannesburg, Budapest, Bratislava, Ziyang, Yancheng, Sydney, Canberra, and Melbourne. Other smaller hotspots, which also ranked highly across the sub-indices, include the Tocantin Basin in Brazil, the Po Valley in Italy, the Douro Basin in Spain, the Swahili Coast in Mozambique and Tanzania, and pockets in South Asia, the Sudanian Savanna, the Great Rift Valley, and the Guianas.
Table 5. Ten Largest GSTRI Hotspots Ranked by Area
| Rank | Approximate Region | Present Countries |
|---|---|---|
| 1 | Eastern Temperate Forests | United States of America |
| 2 | Pampas | Argentina, Uruguay |
| 3 | Australian Temperate Forests | Australia |
| 4 | North China Plain | China |
| 5 | Sichuan Basin | China |
| 6 | Aquitaine and Paris Basin | France |
| 7 | Highveld | South Africa |
| 8 | North Caucasus | Russia, Ukraine |
| 9 | Alto Paraná Atlantic Forests | Brazil, Paraguay, Uruguay |
| 10 | Pannonian Plain | Hungary, Croatia, Slovakia, Bosnia and Herzegovina, Czechia, Serbia, Slovenia, Austria |
Note. The table lists the 10 largest contiguous high-resilience hotspots identified by the GSTRI, ranked by their total land area. The “Approximate Region” column describes the general geographic location or ecological region of the hotspot, and the “Present Countries” column lists the countries in which the hotspot is currently situated.
Discussion
The GSTRI assesses the inherent physical and environmental characteristics of regions that contribute to their ability to sustain or restore functionality in the aftermath of a global catastrophe, thereby reducing vulnerability and enhancing resilience. The major hotspots stand out for their large size and dense clustering of favorable characteristics of sociotechnological critical systems, including suitable climate, high potential for caloric productivity, abundant resource extraction potential, proximity to freshwater, and low risk of natural hazards. The spatial extent and concentration of these advantageous factors within the hotspots suggest a higher capacity to support larger populations and potentially contribute more significantly to long-term civilizational resilience compared to other regions. The presence of major urban centers within these hotspots helps support the hypothesis that these locations are suitable for civilizational recovery, as they currently support significant human activity. Notable examples include the Yangtze River in China, the eastern United States, the Pampas region of Argentina and Uruguay, the southeastern coast of Australia, and the Highveld in South Africa.
Contrary to previous studies that focused solely on islands (Boyd & Wilson, 2020, 2021, 2023) or employed a country-level approach (King & Jones, 2021), this study assessed resilience across all landmasses using a more granular level of analysis. This difference in scope led to the identification of high-resilience regions on continents that were not considered in earlier research. Despite previous studies identifying New Zealand and Iceland as potential refuges, or “collapse lifeboats” (Boyd & Wilson, 2020, 2021, 2023; King & Jones, 2021), this study does not rank these countries among the top locations for inherent resilience. Iceland shows particularly low scores on the GSTRI index, with significant shortcomings in climate and caloric suitability. Although there is a minor hotspot located on the North Island of New Zealand, previous literature has disproportionately focused on this region while neglecting potentially larger and more significant hotspots. Nevertheless, the results from this study continue to recognize Australia as a promising location.
While previous studies incorporated socio-political variables into their analysis, this study focused solely on physical and environmental factors, leading to differences in findings. Previous research that used the ND-GAIN index, which assesses countries’ capabilities to adapt to environmental change (Chen et al., 2015), did not identify the hotspots this study located in continental Europe, the Caucasus, South America, Africa, and East Asia, as having the greatest potential for recovery after a global collapse, as several of this study’s identified hotspots are situated in countries that did not rank among the top 20 nations in the ND-GAIN index. Furthermore, unlike previous research that penalized regions with higher geographical connectivity due to the potential for mass migration that could alter carrying capacities (King & Jones, 2021), this study did not include an isolation analysis. As a result, this study did not penalize France and the United States for their geographic locations, despite their potential vulnerability to migration pressures.
Case Study: Nuclear War
The resilience of locations in the event of a global catastrophe may vary depending on the specific global spread mechanism. While the GSTRI takes a threat-agnostic approach, this section explores the application of the index to a specific global spread mechanism: nuclear war. Nuclear war would likely have significantly different impacts across various regions of the world (Boyd & Wilson, 2022).he Northern Hemisphere would likely experience more severe consequences due to the concentration of nuclear weapon states and potential targets in this region (Kile et al., 2011). Of the nine countries that possess nuclear weapons (Early & Asal, 2014), four contain five major GSTRI hotspots: the United States, France, Russia, and China. While the region around Hungary is the last remaining hotspot in the Northern Hemisphere, it may not be an ideal refuge due to its proximity to nuclear-armed states and its NATO membership. This alliance obligates defense of its members, potentially making Hungary a target in a war involving the United States, the United Kingdom, or France (Grady, 2002).
While Australia contains one of the four major GSTRI hotspots in the Southern Hemisphere, its involvement in AUKUS, a security partnership with the United States and the United Kingdom focused on sharing advanced defense technologies, may increase its risk of being targeted in a great power conflict, particularly by China (Cheng, 2022). The other three major hotspots in the Southern Hemisphere are located in South Africa, Argentina, Uruguay, and Brazil. Their membership or observer status in the Non-Aligned Movement (NAM) may reduce the likelihood of these countries becoming involved in a great power war because NAM membership conditions prevent states from joining multilateral military alliances or signing bilateral military agreements with major powers in global conflicts (Arnold, 2010; Munro, 2024).
Furthermore, atmospheric circulation patterns would likely mitigate the spread of radioactive particles into the Southern Hemisphere, resulting in less drastic cooling and more stable growing seasons (Robock, 2010). Minor hotspots located between the equator and the Tropic of Cancer, such as the Tocantins Basin and the Highlands of Brazil, Southern Andean Yungas of Argentina and Bolivia, and pockets in Tanzania, Zambia, and the Democratic Republic of the Congo, may exhibit even greater resilience under these conditions and could potentially serve as more effective refuges for human populations. However, future research may need to refine the climatic and geopolitical model to fully account for the effects of nuclear war and winter.
Limitations
While the GSTRI assumes that each sub-index contributes independently to the overall resilience score, the moderate correlation between the Climate Suitability Index and the Caloric Suitability Index (Figure 2) suggests that the effects of these factors on overall resilience may not be entirely independent. This multicollinearity indicates potential redundancy in the information captured by these factors. Additionally, although this study aimed to focus solely on physical and environmental factors, socio-economic variables influenced some of the sub-indices. The Climate Suitability Index incorporated data on the global distribution of population densities over time to look at where humans have lived to help estimate optimal locations for human habitability (Xu et al., 2020), and the Development Potential Index included data on inverted population density to model the availability of accessing resources (Oakleaf et al., 2019).
While the study aimed to use present-day physical and environmental characteristics to produce a model of civilizational recovery without temporal specification, rising temperatures and changing precipitation patterns from climate could impact the Climate Suitability Index (Xu et al., 2020), the Caloric Suitability Index (Galor & Özak, 2016), and the Water Scarcity Index (Kummu et al., 2011), by making temperatures inhospitable and altering agricultural productivity and the availability of fresh water. Additionally, the focus on individual hotspots may have overlooked the potential interdependence between high-resilience regions in close proximity, which could modify the overall capacity for civilizational recovery. Trade networks, for example, could enable the sharing of resources between regions and enhance recovery efforts. Inversely, if larger and more accessible hotspots are perceived as more resilient, they may attract migrants that alter the demographic structure and decrease resource availability (King & Jones, 2021).
Future Research
The GSTRI Index provides a foundation for future research that can expand upon this work. Researchers could explore alternative indices, refine existing ones based on new data or methodological advancements, or identify indices that serve as proxies for critical systems not included in this study, such as health and security. To address uncertainties regarding the selection of metrics and sub-indices, future research could involve domain experts to help identify the most relevant and informative indices and determine appropriate weights for each component of the GSTRI.
Future research could also incorporate disruptive event stages not included in the analysis of the GSTRI (Table 1) and consider how different phases of civilizational recovery might require different resilience factors. Investigating whether certain stages should be weighted differently using multi-criteria decision analysis techniques could provide valuable insights. For example, resource extraction is likely more important during the “recovery of industry” stage of civilizational resilience than in previous stages (Baum et al., 2019).
While the GSTRI takes a threat-agnostic approach, future research can explore how critical systems and disruptive event stages may vary under different global spread mechanisms and timeframes (Avin et al., 2018), such as a nuclear war scenario (Section 5.1). A quantitative approach could refine the GSTRI by assigning weights to regions based on their vulnerability to specific threats, such as nuclear war or pandemics, and adding these threats as variables into the model (Equation 1). Additionally, including climate change models and using projected data, such as the Climate Suitability Index for the year 2070 (Xu et al., 2020), could help assess the potential impact of climate change on resilience. Regions with greater economic development and resources, such as the United States, Australia, and Europe, likely have a higher capacity to strengthen their resilience by investing in preparedness measures (Boyd & Wilson, 2021; International Monetary Fund, 2024). Conversely, some hotspot regions, like the Sudanian Savanna, South Asia, and the Guianas, may struggle to implement effective measures due to resource and infrastructure constraints. In the case of extreme pandemics, naturally isolated regions with fewer visitors, such as the Australian Temperate Forests, may have an advantage in preventing pathogen introduction and spread (Boyd & Wilson, 2020).
Implications
By identifying hotspots with inherent physical and environmental characteristics conducive to resilience, this study provides a foundation for understanding the potential of different regions to support the recovery of human populations and the rebuilding of complex societies in the aftermath of a global catastrophe. For regions identified as hotspots, the findings of this study could inform the development of targeted preparedness plans. These plans could focus on optimizing resource management, enhancing self-sufficiency, and strengthening emergency response capabilities to ensure that these regions are well-equipped to support human populations in the aftermath of a global catastrophe. By proactively investing in the resilience of these hotspots, it may be possible to increase their capacity to serve as effective refuges and to support the recovery of civilization after a societal collapse.
Another opportunity would be to bolster the resilience of regions that are not currently identified as hotspots. By assessing the resilience of regions using the GSTRI and its sub-indices, it may be possible to identify their strengths and weaknesses of specific sociotechnological systems, enabling the development of targeted interventions to enhance overall resilience. This could involve improving agricultural practices, strengthening and implementing mitigation measures for natural disasters, such as the Sendai Framework (United Nations, 2015), and developing infrastructure to support self-sufficiency in food, water, and energy production. Investing in the resilience of these regions could help to create a more distributed network of potential refuges, reducing the reliance on a limited number of hotspots and increasing the overall chances of successful civilizational recovery.
Conclusion
The Global Sociotechnological Resilience Index (GSTRI) provides a novel approach for evaluating the inherent resilience of regions based on their physical and environmental attributes. By focusing on granular, location-specific data and excluding socio-political factors, the GSTRI establishes a baseline assessment of the potential for different areas to support civilizational recovery following a global catastrophe. The study identified 218 unique high-resilience hotspots worldwide, with the 10 largest hotspots situated in countries such as the United States, Argentina, Australia, China, and South Africa. These hotspots demonstrate advantageous qualities across various sociotechnological critical systems, indicating a greater likelihood of sustaining human populations and promoting long-term civilizational resilience.
The insights from this study have implications for understanding inherent resilience and guiding preparedness strategies and resource distribution. Targeted interventions in hotspot regions could prioritize resource management, self-sufficiency, and emergency response capacity. Assessing the resilience of non-hotspot regions using the GSTRI and its sub-indices could help identify strengths and weaknesses, enabling targeted measures to improve overall resilience and establish a more dispersed network of potential refuges. However, the GSTRI has limitations, such as potential multicollinearity between sub-indices, the influence of socio-economic variables despite the focus on physical factors, and the static nature of the model, which does not fully incorporate long-term climate change impacts on resilience. Future research should focus on refining the GSTRI by incorporating insights from domain experts, investigating alternative indices, and integrating disruptive event stages and timeframes.
Understanding inherent resilience is crucial for informing civilizational recovery efforts and mitigating the consequences of potential global catastrophes. The GSTRI offers a valuable framework for assessing resilience at a granular level and identifying high-resilience hotspots that could serve as potential refuges in post-catastrophe scenarios. Continued research into high-resilient locations and their implications for civilizational recovery will be crucial for safeguarding our future as the world faces new and old global risks.
References
Arnold, G. (2010). The A to Z of the Non-aligned Movement and Third World (Vol. 172). The Scarecrow Press, Inc.
Anselin, L., Syabri, I., & Kho, Y. (2006). GeoDa: An Introduction to Spatial Data Analysis. Geographical Analysis, 38(1), 5–22. https://doi.org/10.1111/j.0016-7363.2005.00671.x
Aven, T. (2022). On Some Foundational Issues Concerning the Relationship Between Risk and Resilience. Risk Analysis, 42(9), 2062–2074. https://doi.org/10.1111/risa.13848
Avin, S., Wintle, B. C., Weitzdörfer, J., Ó hÉigeartaigh, S. S., Sutherland, W. J., & Rees, M. J. (2018). Classifying global catastrophic risks. Futures, 102, 20–26. https://doi.org/10.1016/j.futures.2018.02.001
Baum, S. D. (2018). Resilience to global catastrophe. In Trump, B. D., Florin, M.-V., & Linkov, I. (Eds.). IRGC resource guide on resilience (vol. 2): Domains of resilience for complex interconnected systems. Lausanne, CH: EPFL International Risk Governance Center. https://doi.org/10.5075/epfl-irgc-262527
Baum, S. D., Armstrong, S., Ekenstedt, T., Häggström, O., Hanson, R., Kuhlemann, K., Maas, M. M., Miller, J. D., Salmela, M., Sandberg, A., Sotala, K., Torres, P., Turchin, A., & Yampolskiy, R. V. (2019). Long-term trajectories of human civilization. Foresight, 21(1), 53–83. https://doi.org/10.1108/FS-04-2018-0037
Beard, S., and Torres, P. (2020). Identifying and assessing the drivers of global catastrophic risk: A review and proposal for the global challenges foundation. Global Challenges Foundation. https://globalchallenges.org/library/identifying-and-assessing-the-drivers-of-global-catastrophic-risk-2019/
Beckstead, N. (2015). How much could refuges help us recover from a global catastrophe? Futures, 72, 36–44. https://doi.org/10.1016/j.futures.2014.11.003
Belfield, H. (2023). Collapse, Recovery, and Existential Risk. In M. Centeno, P. Callahan, P. Larcey, T. Patterson (Eds.), How Worlds Collapse: What History, Systems, and Complexity Can Teach Us About Our Modern World and Fragile Future (pp. 61-92). Routledge. https://doi.org/10.4324/9781003331384
Bostrom, N., & Ćirković, M. (2008). Introduction. In N. Bostrom & M. M. Cirkovic (Eds.), Global Catastrophic Risks (p. 0). Oxford University Press. https://doi.org/10.1093/oso/9780198570509.003.0004
Boyd, M., & Wilson, N. (2020). The Prioritization of Island Nations as Refuges from Extreme Pandemics. Risk Analysis, 40(2), 227–239. https://doi.org/10.1111/risa.13398
Boyd, M., & Wilson, N. (2021). Optimizing Island Refuges against global Catastrophic and Existential Biological Threats: Priorities and Preparations. Risk Analysis, 41(12), 2266–2285. https://doi.org/10.1111/risa.13735
Boyd, M., & Wilson, N. (2023). Island refuges for surviving nuclear winter and other abrupt sunlight‐reducing catastrophes. Risk Analysis, 43(9), 1824–1842. https://doi.org/10.1111/risa.14072
Center For Hazards and Risk Research – CHRR – Columbia University, Center For International Earth Science Information Network – CIESIN – Columbia University, & International Bank For Reconstruction And Development – The World Bank. (2005). Global Multihazard Frequency and Distribution [Dataset]. Palisades, NY: NASASocioeconomic Data and Applications Center (SEDAC). https://doi.org/10.7927/H45718Z5
Chen, C., Noble, I., Hellmann, J., Coffee, J., Murillo, M., & Chawla, N. (2015). University of Notre Dame Global Adaptation Index. University of Notre Dame. https://gain.nd.edu/assets/254377/nd%20gain_technical_document_2015.pdf
Cheng, M. (2022). AUKUS: The Changing Dynamic and Its Regional Implications. European Journal of Development Studies, 2(1), 1–7. https://doi.org/10.24018/ejdevelop.2022.2.1.63
Cotton‐Barratt, O., Daniel, M., & Sandberg, A. (2020). Defence in Depth Against Human Extinction: Prevention, Response, Resilience, and Why They All Matter. Global Policy, 11(3), 271–282. https://doi.org/10.1111/1758-5899.12786
Dilley, M., Chen, R. S., Deichmann, U., Lerner-Lam, A. L., Arnold, M., Agwe, J., Buys, P., Kjekstad, O., Lyon, B., & Yetman, G. (2005). Natural Disaster Hotspots: A Global Risk Analysis (Vol. 5). World Bank. http://documents.worldbank.org/curated/en/621711468175150317/Natural-disaster-hotspots-A-global-risk-analysis
Early, B. R., & Asal, V. (2014). Nuclear Weapons and Existential Threats: Insights from a Comparative Analysis of Nuclear-Armed States. Comparative Strategy, 33(4), 303–320. https://doi.org/10.1080/01495933.2014.941720
Galor, O., & Özak, Ö. (2016). The Agricultural Origins of Time Preference. The American Economic Review, 106(10), 3064–3103. http://www.jstor.org/stable/43956943
Grady, B. C. (2002). Article of the North Atlantic Treaty: Past, Present, and Uncertain Future. Georgia Journal of International and Comparative Law, 31, 167.
GRASS Development Team. (2023). Geographic Resources Analysis Support System (GRASS) Software, Version 8.3. Open Source Geospatial Foundation. https://grass.osgeo.org
International Monetary Fund. (2024). World Economic Outlook Database. Retrieved from https://www.imf.org/en/Publications/WEO/weo-database/2024/April
Kile, S. N., Fedchenko, V., Gopalaswamy, B., & Kristensen, H. M. (2011). World Nuclear Forces. SIPRI Yearbook 2011, 351-2.
Kemp, L., Xu, C., Depledge, J., Ebi, K. L., Gibbins, G., Kohler, T. A., Rockström, J., Scheffer, M., Schellnhuber, H. J., Steffen, W., & Lenton, T. M. (2022). Climate Endgame: Exploring catastrophic climate change scenarios. Proceedings of the National Academy of Sciences, 119(34), e2108146119. https://doi.org/10.1073/pnas.2108146119
Kennedy, C. M., Fariss, B., Oakleaf, J. R., Garnett, S. T., Fernández-Llamazares, Á., Fa, J. E., Baruch-Mordo, S., & Kiesecker, J. (2023). Indigenous Peoples’ lands are threatened by industrial development; conversion risk assessment reveals need to support Indigenous stewardship. One Earth, 6(8), 1032–1049. https://doi.org/10.1016/j.oneear.2023.07.006
King, N., & Jones, A. (2021). An Analysis of the Potential for the Formation of ‘Nodes of Persisting Complexity.’ Sustainability, 13(15), 8161. https://doi.org/10.3390/su13158161
Kummu, M., de Moel, H., Ward, P. J., & Varis, O. (2011). How close do we live to water? A global analysis of population distance to freshwater bodies. PloS One, 6(6), e20578. https://doi.org/10.1371/journal.pone.0020578
Linkov, I., & Trump, B. D. (2019). The Science and Practice of Resilience. Springer International Publishing. https://doi.org/10.1007/978-3-030-04565-4
Maher, T., & Baum, S. (2013). Adaptation to and Recovery from Global Catastrophe.
Sustainability, 5(4), 1461–1479. https://doi.org/10.3390/su5041461
Munro, A. (2024). Non-Aligned Movement. Encyclopedia Britannica. https://www.britannica.com/topic/Non-Aligned-Movement
Oakleaf, J. R., Kennedy, C. M., Baruch-Mordo, S., Gerber, J. S., West, P. C., Johnson, J. A., & Kiesecker, J. (2019). Mapping global development potential for renewable energy, fossil fuels, mining and agriculture sectors. Scientific Data, 6(1), 101. https://doi.org/10.1038/s41597-019-0084-8
Oakleaf, J., M. Kennedy, C., Baruch-Mordo, S., Gerber, J., C. West, P., Johnson, J. A., & Kiesecker, J. (2019). Global development potential indices for renewable energy, fossil fuels, mining and agriculture sectors (Version 2). figshare. https://doi.org/10.6084/m9.figshare.c.4249532.v2
Ord, J. K., & Getis, A. (1995). Local spatial autocorrelation statistics: distributional issues and an application. Geographical Analysis, 27(4), 286-306. https://doi.org/10.1111/j.1538-4632.1995.tb00912.x
QGIS.org. (2024). QGIS Geographic Information System. Open Source Geospatial Foundation Project. http://qgis.org
Robock, A. (2010). Nuclear winter. Wiley Interdisciplinary Reviews: Climate Change, 1(3), 418–427. https://doi.org/10.1002/wcc.45
Schoch-Spana, M., Cicero, A., Adalja, A., Gronvall, G., Kirk Sell, T., Meyer, D., Nuzzo, J. B., Ravi, S., Shearer, M. P., Toner, E., Watson, C., Watson, M., & Inglesby, T. (2017). Global Catastrophic Biological Risks: Toward a Working Definition. Health Security, 15(4), 323–328. https://doi.org/10.1089/hs.2017.0038
Weiss, D. J., Nelson, A., Gibson, H. S., Temperley, W., Peedell, S., Lieber, A., Hancher, M., Poyart, E., Belchior, S., Fullman, N., Mappin, B., Dalrymple, U., Rozier, J., Lucas, T. C. D., Howes, R. E., Tusting, L. S., Kang, S. Y., Cameron, E., Bisanzio, D., Battle, K. E., Bhatt, S., & Gething, P. W. (2018). A global map of travel time to cities to assess inequalities in accessibility in 2015. Nature, 553(7688), 333–336. https://doi.org/10.1038/nature25181
United Nations. (2015). Sendai framework for disaster risk reduction 2015–2030. Geneva, Switzerland: United Nations.
Xia, L., Robock, A., Scherrer, K., Harrison, C. S., Bodirsky, B. L., Weindl, I., Jägermeyr, J., Bardeen, C. G., Toon, O. B., & Heneghan, R. (2022). Global food insecurity and famine from reduced crop, marine fishery and livestock production due to climate disruption from nuclear war soot injection. Nature Food, 3(8), 586–596. https://doi.org/10.1038/s43016-022-00573-0
Xu, C., Kohler, T. A., Lenton, T. M., Svenning, J. C., & Scheffer, M. (2020). Future of the human climate niche. Proceedings of the National Academy of Sciences, 117(21), 11350–11355. https://doi.org/10.1073/pnas.1910114117
Xu, C., Kohler, T. A., Lenton, T. M., Svenning, J. C., & Scheffer, M. (2021). Future of the human climate niche [Dataset]. Dryad. https://doi.org/10.5061/dryad.fj6q573q7
Appendix A
Table A1. GIS Data Sources
| File name | Year published | Year of data collection | Location | Format / file type | Coordinate system | Spatial resolution | Content[1] | Download site |
| Niche_current.tif | 2021 | 2021 | World | GeoTIFF | OGC:CRS84 - WGS 84 (CRS84) | ¹⁄₁₂’ × ¹⁄₁₂’ | Areas most suitable for human habitability | https://doi.org/10.5061/dryad.fj6q573q7 |
| post1500OptCaloriesNo0.tif | 2016 | 2016 | World | GeoTIFF | EPSG:4326 - WGS 84 | ¹⁄₁₂’ × ¹⁄₁₂’ | Highest possible caloric output achievable | https://github.com/ozak/Caloric-Suitability-Index |
| CountryMaxClassifiedWithZeros.tif | 2023 | 2020 | World | GeoTIFF | WGS_1984_Mollweide | 1,000 meters² | Development potential of land | https://tnc.app.box.com/s/cyu1w0c14h8fhl1ln3s01rbj8ickas0t |
| distance2water_30arcsec.tif | 2011 | 2011 | World | GeoTIFF | EPSG:4326 - WGS 84 | ¹⁄₁₂₀’ × ¹⁄₁₂₀’ | Distance from freshwater body | https://doi.org/10.5061/dryad.71c6r |
| gdmhz.asc | 2000 | 2000 | World | ASCII | EPSG:4326 - WGS 84 | ¹⁄₂₄’ × ¹⁄₂₄’ | Natural hazard frequency | https://sedac.ciesin.columbia.edu/downloads/data/ndh/ndh-multihazard-frequency-distribution/gdmhz.zip |
Appendix B
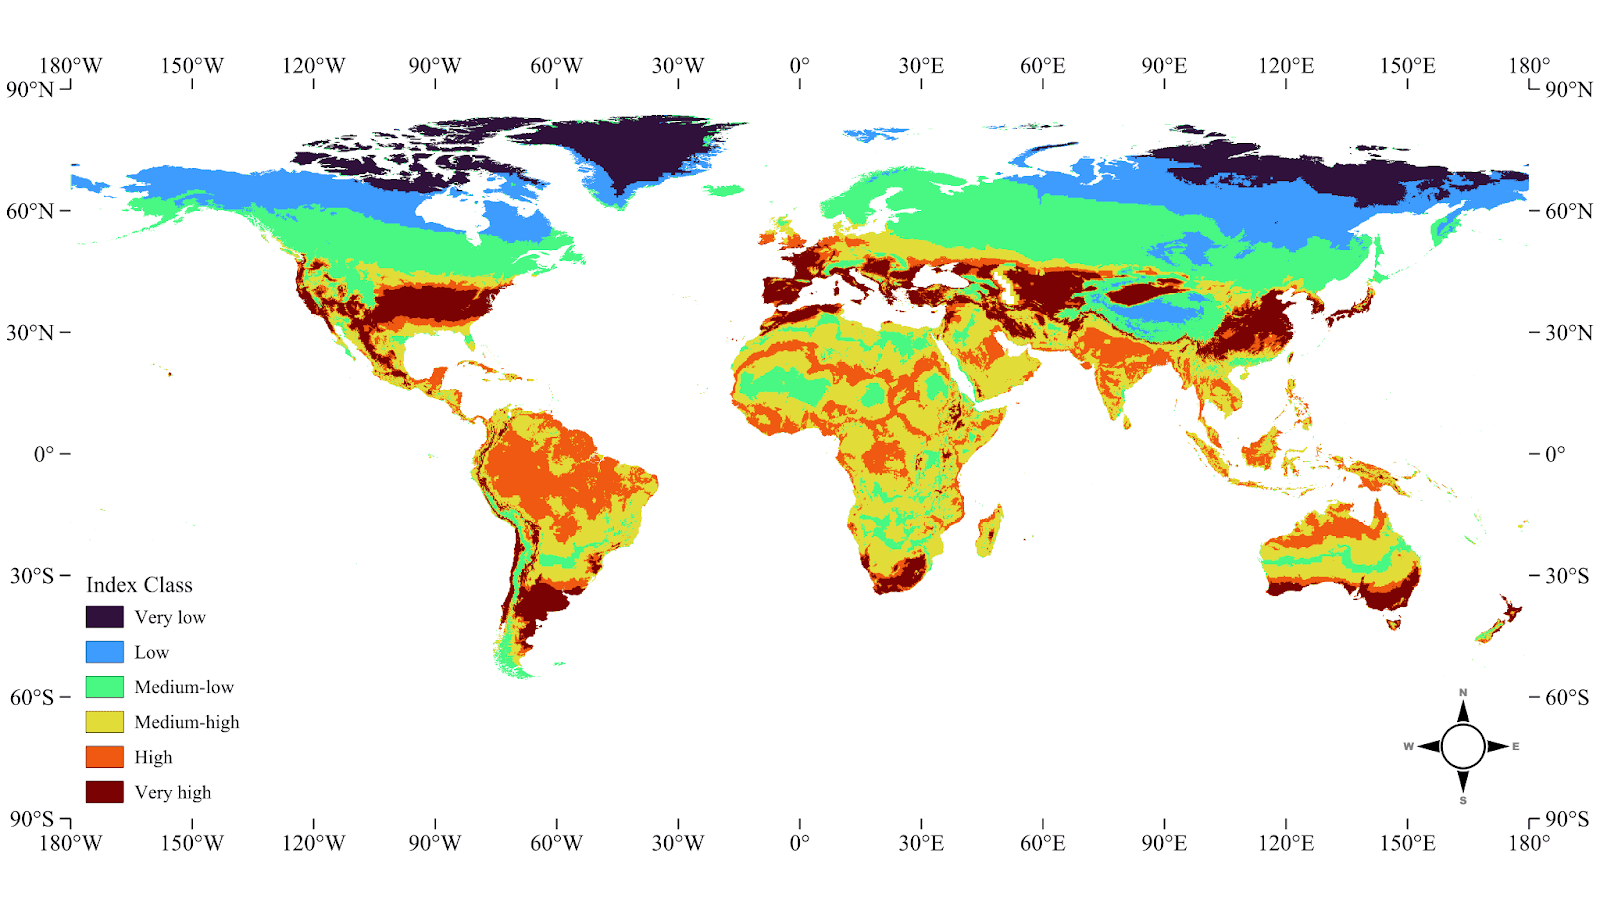
GSTRI Sub-Index Maps. This appendix consists of the maps of the sub-indices used to create the GSTRI.
- ^
This column pertains to the content that was used in the analysis, rather than the full content of the data source.