At the recent EA Global, Will MacAskill called for the community to be ambitious and aim for non-marginal impacts. Ben Todd of 80,000 hours has also made ambition a theme, especially in regards to career choice. In this post, I develop some key ideas that seem important for prioritizing ambitious funding opportunities.
If you care about the social impact of your funding then you need to care about how other funders react to your actions. Scale, Neglectedness, Solvability (SNS) framing, at least as usually explained, doesn't account for such considerations. This could be an issue now that EA wants to pursue ambitious projects that will overlap with more stakeholders.
To address this issue, I have developed a model for impact in equilibrium. In the past I’ve only discussed this with technical audiences. For this post I've put together diagrams to explain the key ideas.
The main points are:
- Scalability. That is, how much the effectiveness of a funding opportunity, whether nonprofit or for profit, persists with scale. Funding GiveDirectly is an example of an opportunity that is regarded as scaling relatively well. Scalability is already an implicit part of Solvability in SNS, but it stands out on its own in general equilibrium.
- Urgency versus patience. To determine the ‘urgency’ of giving now, we need to compare it to 'investing to give' to the best funding opportunity in the future. This determines how much you should value impacts now compared to financial returns. In turn, this is crucial to assessing the tradeoffs involved in impact investing. Differences in urgency between funders will determine who funds what and how much.
- Risk. Risk is a key driver of for-profit enterprise size. If we allow for 'altruistic' risk too, then risk can also be a key consideration for nonprofit enterprises. Part of the impact of funding an opportunity is helping the market by sharing the risk.
- New takes on neglectedness. New ways of looking at neglectedness emerge in equilibrium. 'Investment neglectedness' is a ratio that highlights that it is more impactful to fund a project when its existing funders are less wealthy. But, all else equal (given the same access to funding), it is a positive sign if a project has already been able to attract investment. 'Value neglectedness' is a ratio that highlights that your impact on a funding opportunity will be greater when you value its impacts more than other funders.
This post is long but I feel that is necessary to cover all the main ideas. I plan to cover specific applications of these concepts in shorter posts in the future.
All sorts of questions, comments, and feedback on this post are very welcome and would be appreciated.
Background
This post is based on my work at the Total Portfolio Project. Our goal is to help EAs and aligned investors prioritize the most impactful funding opportunities. Whether these opportunities are grants, 'investing to give' or impact investments. Projects that we've completed so far range from theoretical research (like in this post), to advising on high impact investment deals, to strategic research on balancing 'give now versus later' for new major EA funders.
We see many investment-related research topics that are important, neglected, and tractable. Especially for financial professionals and academics who have a deep enough understanding of EA thinking (and we aim to help build this community). Topics we see as neglected include ‘give now versus later’, patient philanthropy, altruistic leverage and mission correlation.
As a step towards getting EA-aligned ideas considered by leading financial economists, I’ve prepared these two working papers. The goal of this post is to present some of the key results of the latter paper in a less technical way. Some algebra is still necessary to keep things precise.
We are always happy to talk with potential new partners and collaborators, so please get in touch via email.
Urgency and the ‘value’ of impact
You can skip this section if you want to jump straight to the equilibrium diagrams and avoid these formulas. You just need to accept that I'm somehow combining impact and financial returns together into a single definition of 'value'.
We will want to compare the financial values and impacts generated by an enterprise, whether nonprofit or for profit[1]. To do this, let's start by expressing financial values in terms of the impact they can generate.
Suppose that with your next dollar you can donate to a (nonprofit) enterprise with impact per dollar . Or you can 'invest to give' at the risk-free interest rate and then donate with forecast impact per dollar at the next point in time. At the ‘equilibrium’ point where you're doing the most good with your money you'll balance these two options so that
To include for-profit opportunities, suppose that you actually expect to receive a financial return of on your investment in the enterprise. For example if you expect it will be able to use your dollar to make a profit of $0.10, plus repaying your invested dollar, then .
We’ll also include an adjustment of for risk aversion. The fundamental reason for this is the diminishing marginal utility of wealth. You can then plan to donate this risk-adjusted return with impact per dollar so at equilibrium
This is illustrated by the diagram below
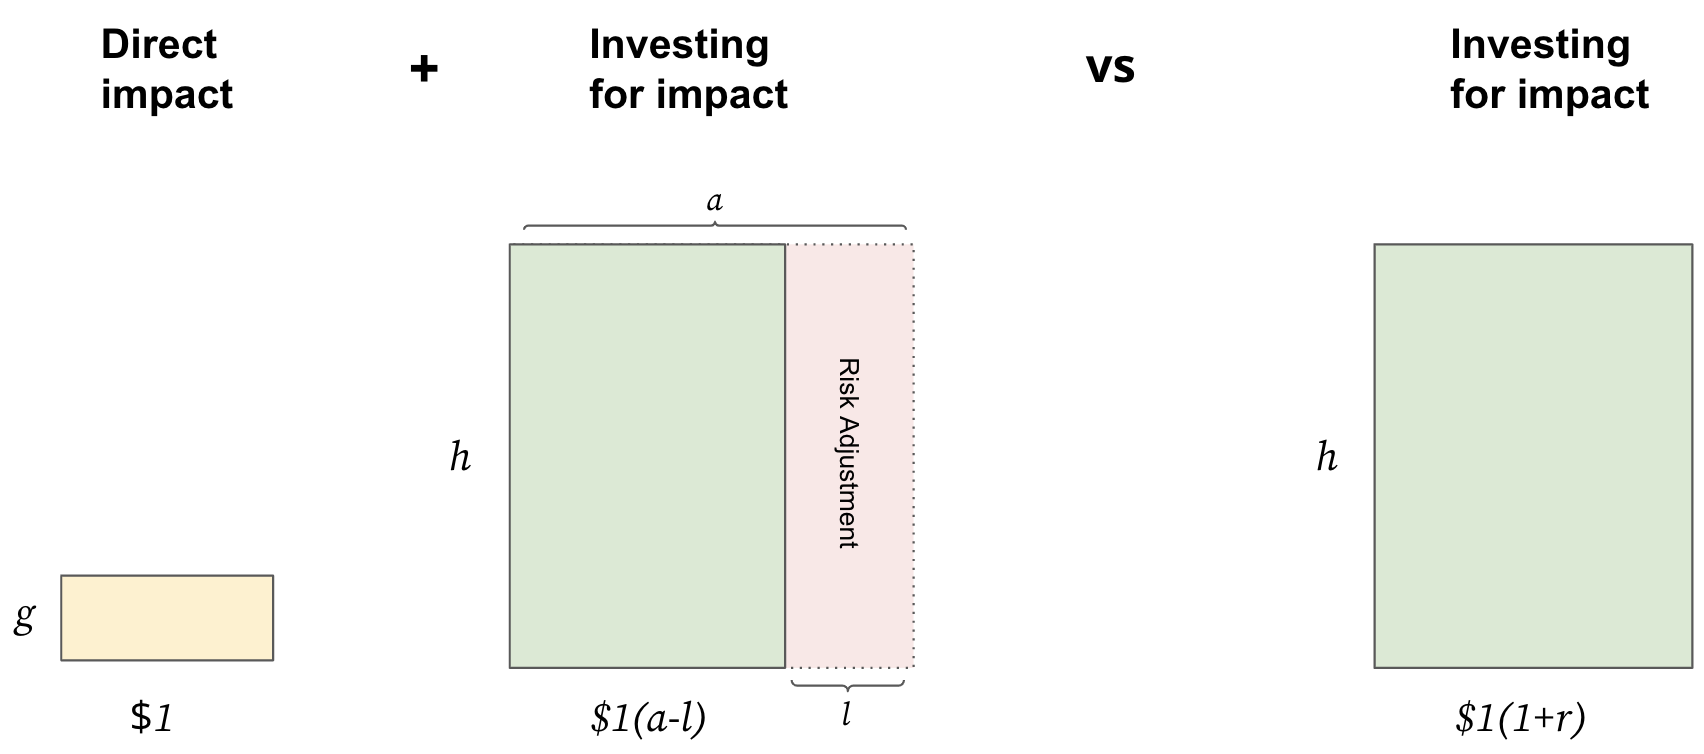
It will be useful to convert this expression into its equivalent in terms of financial returns. We can do this by dividing by . The result is
Letting this can be viewed as expressing the 'urgency' of generating impact now. If is low, then you're expecting your future impact per dollar to be low, so u is relatively high and giving now is more urgent.
We can then think of as being the 'impact return' of your investment. This is represented in the following diagram
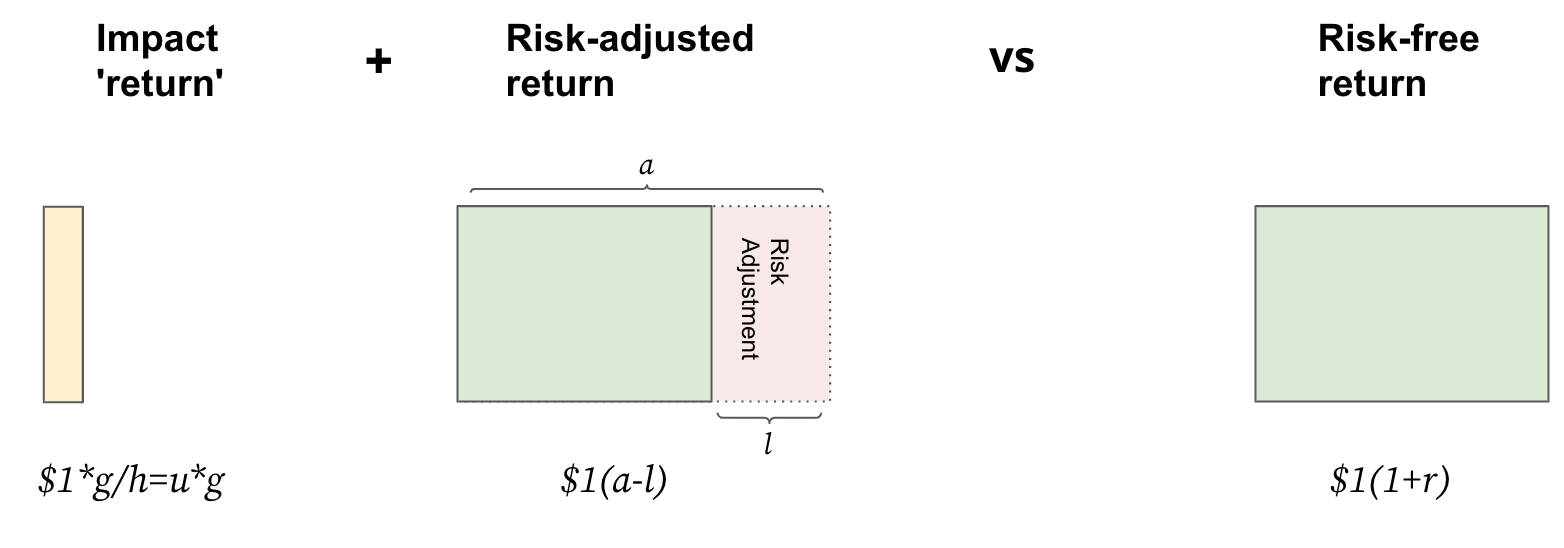
It will be useful to express this relationship as
where I've shifted to the right-hand side so we have beneficial values on one side and ‘opportunity costs’ on the other (the basic opportunity cost of , and the 'cost of risk', ).
This setup is very general even though it only covers a single time period. For example, it could be that you could realize by donating to an effective charity. Or it could be the impact per dollar you expect from continuing to invest to give.
Of course, a complex range of considerations can go into determining (learning rates, discount rates and so on). But the resulting level of urgency is summarized in this single value of .
Your belief about the urgency '' defines whether or not you should lean towards urgently giving or following a patient philanthropy approach (or something in between).
The level of '' becomes particularly crucial if you want to assess an impact investment that involves non-trivial trade offs between and .
How does this relate to 'give now versus later'?
To examine this question we need to compare the 'impact return' of giving now () to the risk-adjusted return of investing (to give). Giving now will be better for urgency
Similarly, given a grant will only have a net positive return (and impact) if
So, only highly effective grants that meet this condition will be 'worth doing'.
Note that the actual answer to 'give now versus later' will almost always be 'both' because of diminishing returns to scale and other considerations. But the above equation is how you would decide between these two options for fixed parameter values.
What about 'impact compounding over time' or 'investment-like giving opportunities'?
You might think about impacts that seem to compound over time in a way that seems similar to investment returns. For example, funding meta-organizations that seek to grow the EA community.
From the perspective of this abstract framework there isn't actually anything magic going on with such opportunities. You handle these cases simply by making sure that fully reflects the expected impact. If this means needs to be higher to reflect such investment-like effects, then you can simply make higher than the value you would otherwise have given it.
Determining the level of urgency
To assess the value of , you need to forecast the marginal cost-effectiveness of your donations at the next point in time. Because this will be the cost-effectiveness of your 'marginal dollar', by definition you must expect that your future donations to a given area will have cost-effectiveness ratios equal to or lower than . So you can focus on each cause area and forecast the cost-effectiveness of marginal donations at the next point in time. These forecasts then provide an upper bound on your . Sjir Hoeijmakers's report on 'investing to give' presents real examples of such forecasts.
Some may be inclined to avoid such forecasts, claiming that the uncertainty is too great. But the very act of making those projections, flawed though they may be, can prove to be the first step in recognizing important strategic insights about a cause area.
A wonderful example of how this can look is the chart of expected impact per dollar by year in the climate-related analysis by Johannes Ackva and Anu Khan from Founders Pledge. Their forecasts suggest at a 1-year horizon, so that . This suggests that climate-focused funders will get an ‘1-year impact return’ of 210% by putting money into the Founders Pledge Climate Change Fund in 2021 rather than investing to give a year later.
The other extreme is represented by the Founders Pledge Patient Philanthropy Fund (PPF). The design of this fund implies the view that . This makes ‘investing to give’ look like the more attractive option.
Note that the PPF’s is very different from (i.e. not being altruistic). It may be easy to feel like these values of are the same if you look around and observe many urgent projects that seem worth funding (like FP’s Climate Change Fund!). However, the PPF is of course committed to deploying its assets for maximum good over time.
How to balance different levels of urgency in different cause areas, with different worldviews, is a subject for another time. For now, I'll just say that, thanks to Founders Pledge you have both highly urgent and patient fund options.
Equilibrium: value and opportunity costs
Now that we have a way to put financial values and impact on the same terms, we can start to analyze investment in an enterprise called ABC. To begin with we'll just consider investment by the 'market' (of all other funders except you).
The market sees value in ABC because of the impacts and profits that ABC produces per dollar invested. And the market has opportunity costs because it could invest elsewhere and generate value as well. So, in equilibrium the market will invest up to the point where the marginal value per dollar equals its opportunity cost per dollar. This is shown in the diagram below where the equilibrium amount of investment is IO (left vertical dotted line).
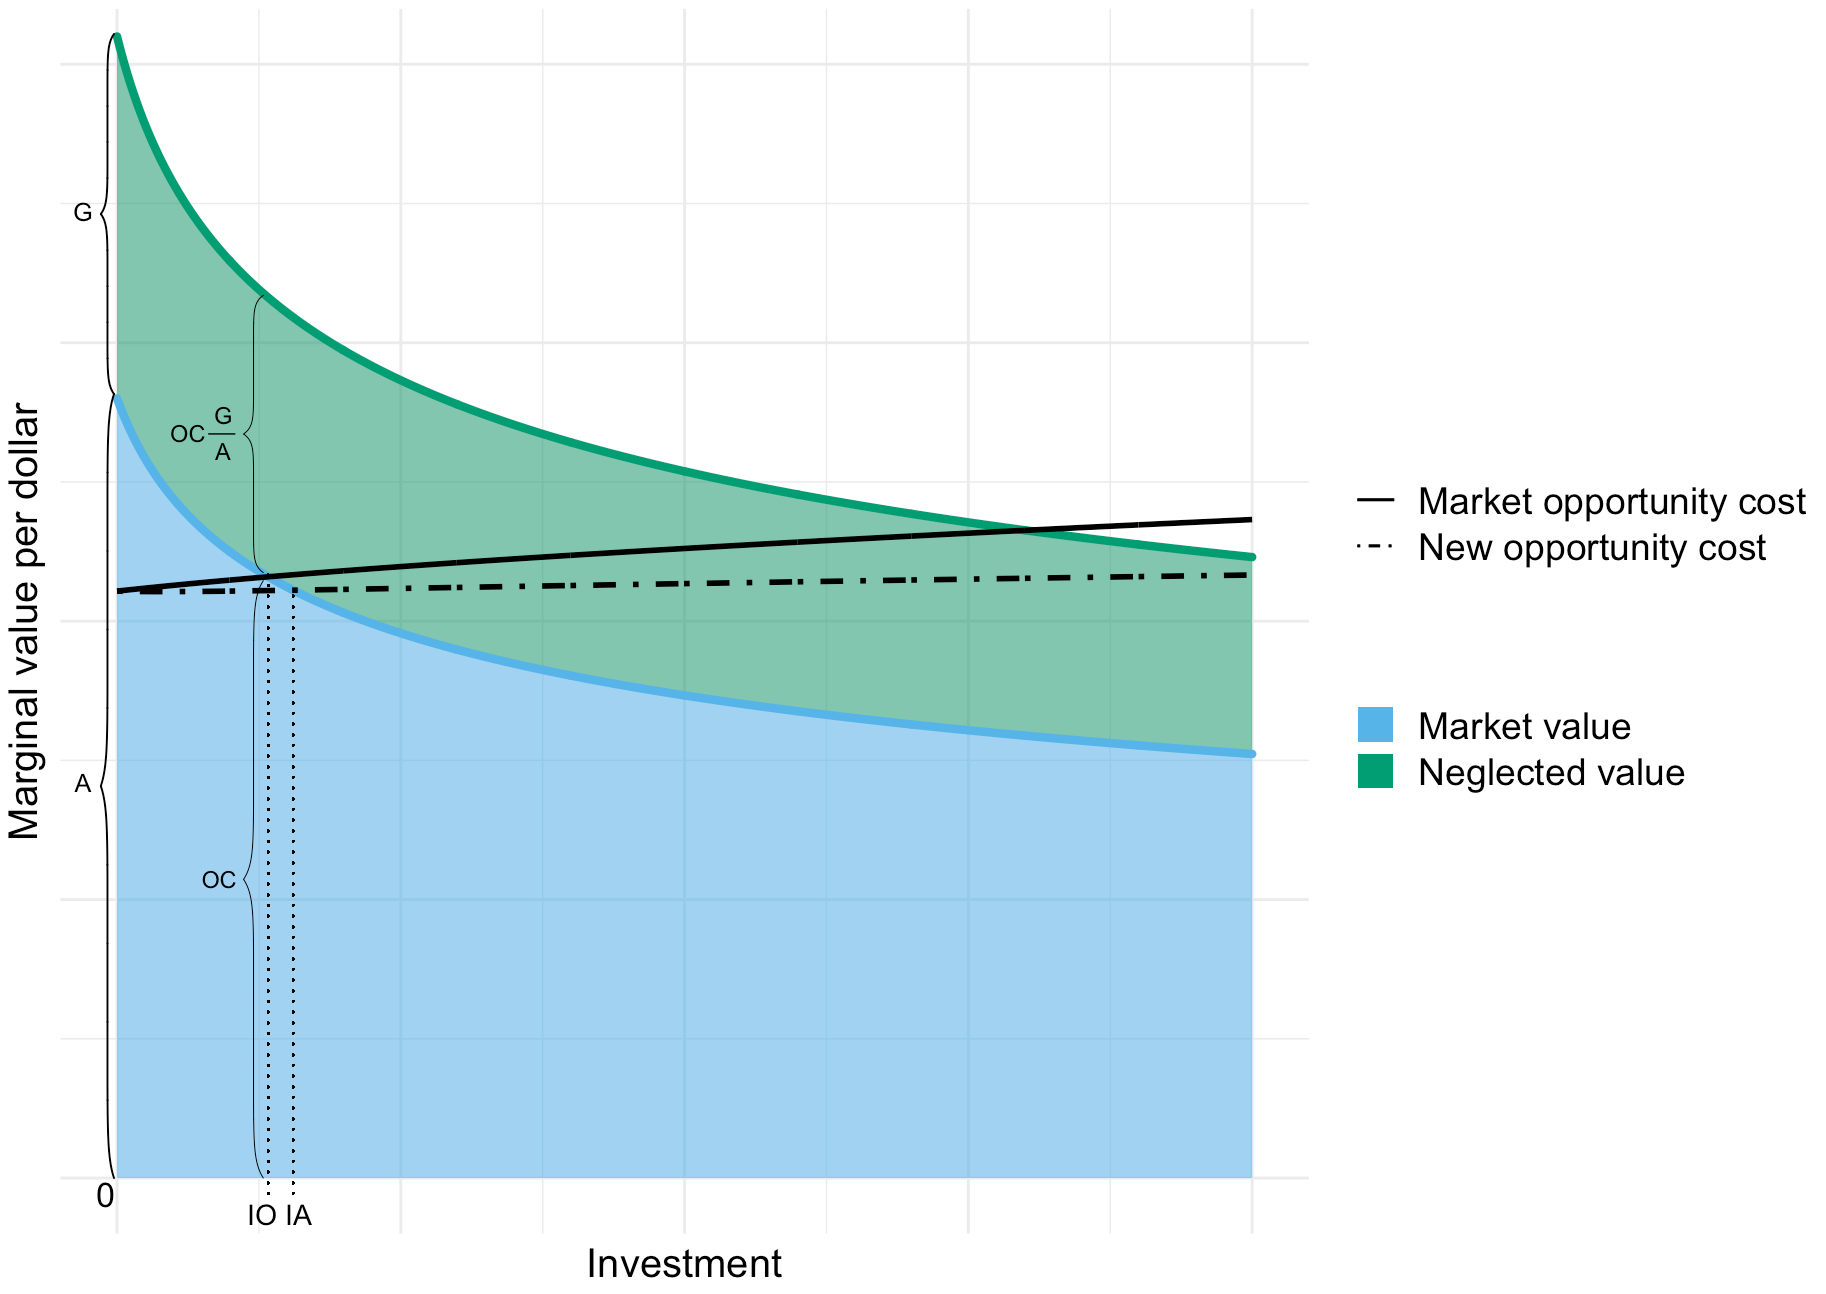
If the opportunity costs were lowered to the 'New opportunity cost' curve in the diagram then the equilibrium investment would increase to IA (right vertical dotted line).
Separate from the market's beliefs you may see additional value in ABC. This is shown in the diagram as 'Neglected value'. I expect this to usually arise as different beliefs about impact (but in general it could also be about different financial beliefs). You might think the enterprise is more impactful. Or you might see greater urgency in its impacts.
This model applies equally well to nonprofit and for-profit enterprises. Though feel free to think of ABC as being a nonprofit for the rest of this post.
Marginal impact in equilibrium
We can use this model to think about the marginal impacts of small funders, which have recently been discussed here and here. Your marginal impact is the impact of providing ABC with a small, fixed amount of additional funding.
If we ignored equilibrium effects, and assumed your opportunity cost was similar to the market's, the net value per dollar created by your investment will be the neglected value per dollar at investment level IO.
We can infer this value if we assume that the neglected values and market values have similar rates of diminishing returns to scale. Relative to the initial neglected value per dollar 'G' at zero investment, at IO it will be reduced by the ratio of 'A', the market value per dollar at zero investment, and the opportunity cost level 'OC' at IO. Thus the neglected value per dollar will be
where
I call this 'Value neglectedness' because the larger it is the more the market is neglecting the full value inherent in ABC.
If you could add your funding to ABC with no other funders reacting, then the 'Value neglectedness' would be your net impact value per dollar. However, to properly assess your impact in equilibrium we need to let the market react to your investment.
In this model the way your investment can affect ABC is by changing the market's opportunity cost curve because it means that the cost of risk is shared more widely. This will shift the cost curve down and increase investment in equilibrium. The 'New opportunity cost' curve in the diagram above is an exaggerated example of this.
With for profits the ideas of risk and diversification are standard and uncontroversial. It is not obvious that risk should apply to nonprofits. However, arguably, there are altruistic equivalents to financial risk. For example, nervousness about being a nonprofit's main source of funding.
If there is no shareable risk and your investment doesn't change the market's opportunity costs, then the other funders will reduce their investment in ABC by an amount equal to your investment. This will keep the equilibrium at IO.
Because of such equilibrium effects, to assess the net value generated by your investment, we need to consider how you value your opportunity costs and those of the market.
For example, you might see ABC as being 10x GiveDirectly (GD) while the market sees it as more like 5x GD. If your funding for ABC 'funges' with the market then this will result in an equal amount of funding moving elsewhere. Since the market is funding ABC while believing it is 5x GD, funging will probably lead to it funding something else that is also 5x GD. So your investment will turn out to have an effectiveness of 5x GD rather than 10x GD.
Such considerations lead to the four areas highlighted in the diagram below.
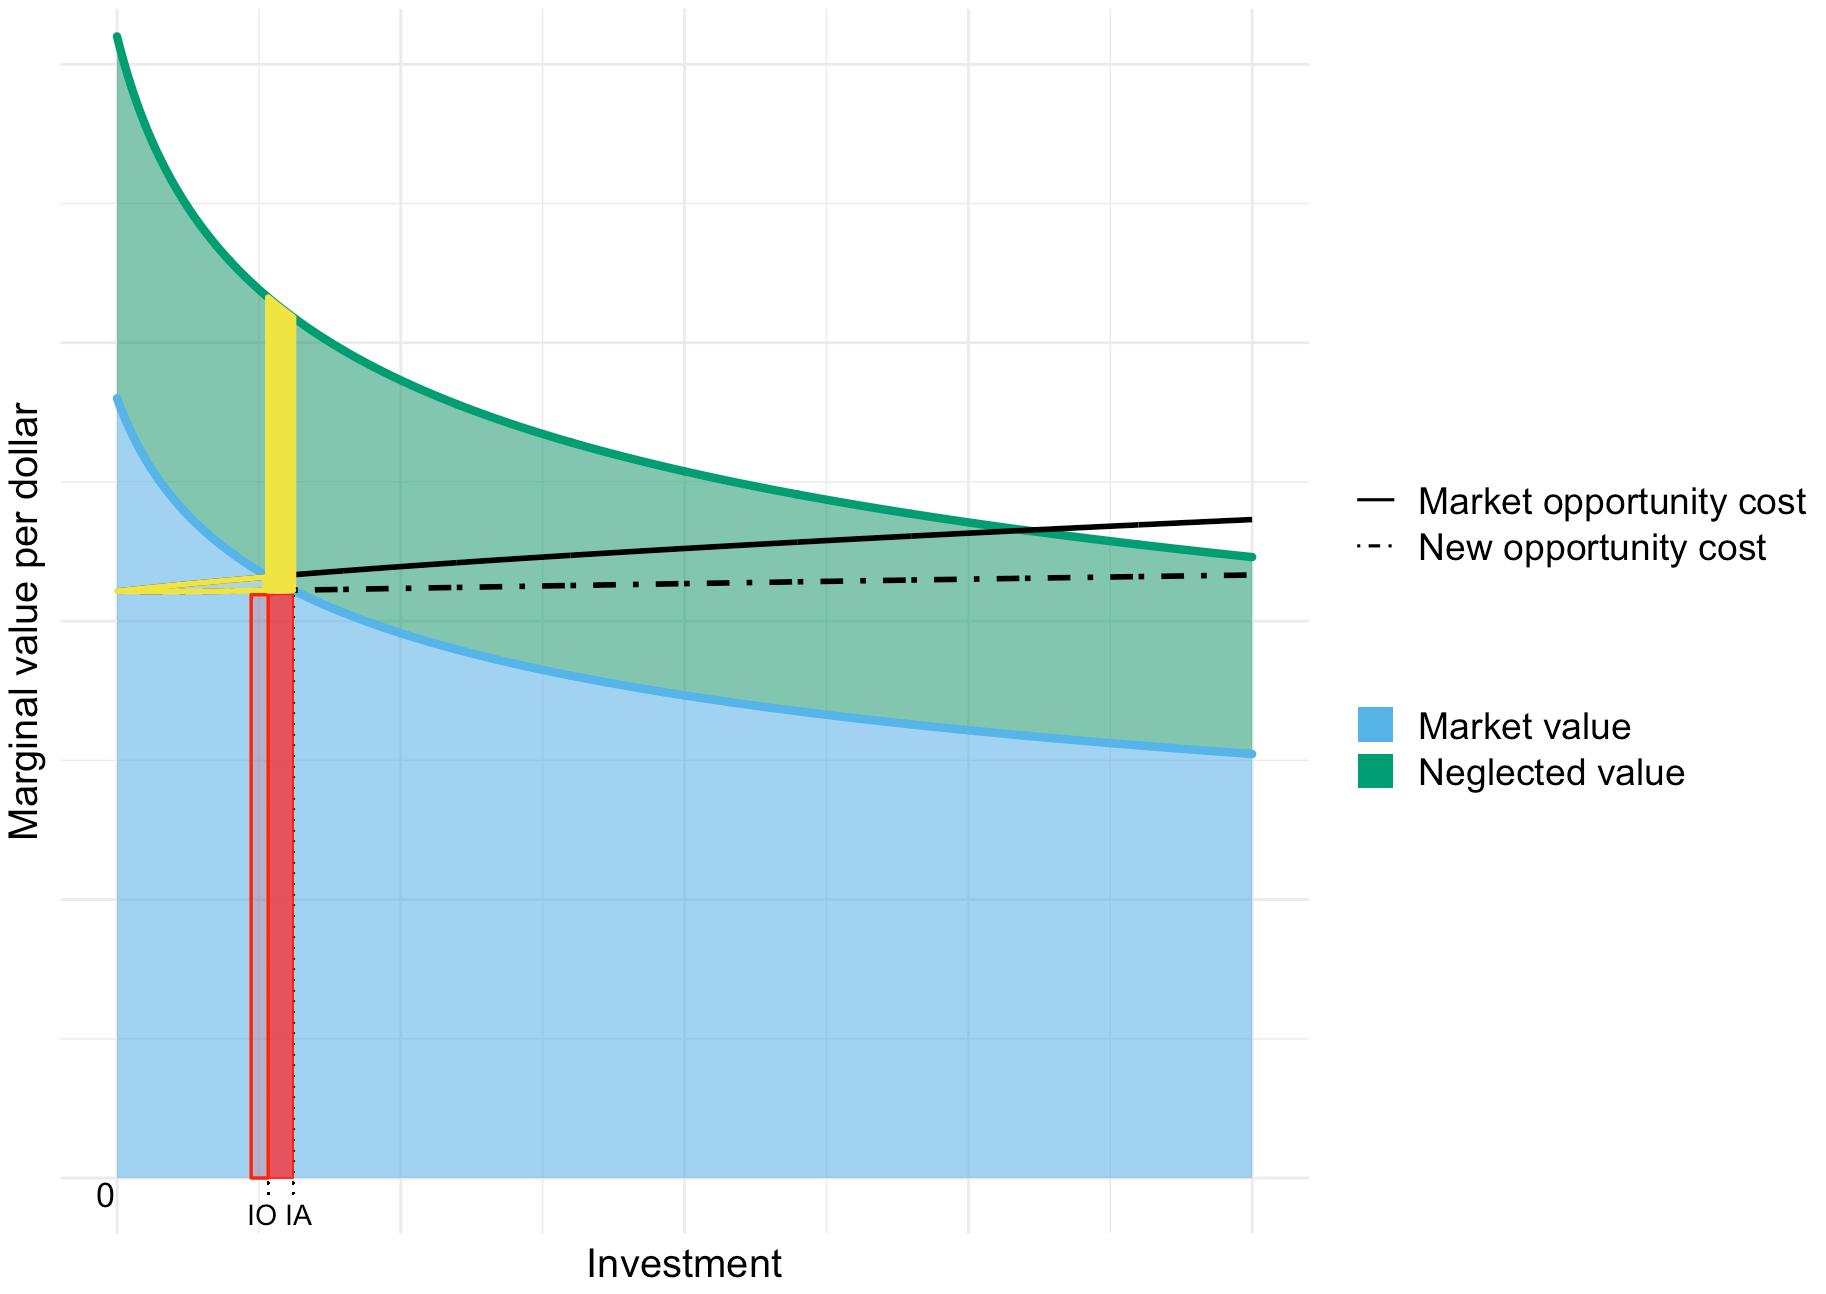
| Area | Value? |
| Yellow, solid area | Generally positive |
| Yellow triangle | Zero to positive Depends if market is aligned |
| Red, solid area | Zero to positive Depends on your opportunity costs |
| Red, hollow area | Negative to positive Depends on your opportunity costs Depends if market is aligned |
The yellow, solid area represents the impact value that is independent of any opportunity costs (as long as your opportunity costs aren't higher than the market's).
The red, solid area represents value that is created by your investment but that falls within the bounds of your opportunity costs - assuming your opportunity costs are similar to those of the market. If they are, then this area represents zero value. If your opportunity costs are lower than the market's (e.g. it is money you otherwise wouldn't use altruistically or for essentially personal spending) then this area can represent positive value.
The red, hollow area illustrates that some of your investment will 'funge' with the market, pushing some of its investment out of ABC. If you judge the market to be aligned, so that outside ABC it will make investments with similar altruistic value, then this will cancel out or exceed your opportunity costs. So the area will have zero or higher value. However, if you have opportunity costs and you don't view the market as aligned then this area could have negative value.
The hollow, yellow triangle illustrates that if you view the market as aligned then you will see value in having reduced their opportunity costs (by sharing the risk).
Estimating the value of your marginal impact
I'm going to focus on the yellow, solid area. The values of the other areas could be estimated in a similar way, but will depend on judgments about your opportunity costs and alignment with the market.
The value of the yellow, solid area is going to be roughly equal to its height (the OC*'Value neglectedness') multiplied by the investment change (IA-IO).
The investment change is going to depend on the amount your investment changes the market's opportunity cost and on the slope 'S' of the (blue) value curve near IO. To capture this I define
The higher Scalability is the more ABC's value produced per dollar will stay high as it scales.
Multiplying by should make Scalability more stable across a range of IO and OC values, and make differences in Scalability more meaningful between enterprises with different IO's and OC's .
The investment change will then be
The fractional contribution of your investment to risk diversification, thereby lowering the market's opportunity cost, will be proportional to the amount of your funding, inversely proportional to the current amount of investment (IO), and proportional to amount of the equilibrium opportunity cost due to risk that can be diversified. I'll call the ratio between the latter portion of the opportunity cost and OC the 'Risk'.
Putting this all together, the IO terms cancel out, so the value of the yellow, solid area will be
Minor non-marginal impact
In general, non-marginal investment means any investment that is not 'at the margin'. That is, an investment that is substantial enough to change the features of the opportunity in some way. I'm going to use 'non-marginal' here to mean investing to the point where further investment no longer exceeds your own opportunity costs.
Non-marginal investments are likely to be particularly valuable if you have a lot of wealth and only a finite capacity (e.g. time) to analyze and monitor investments. You will want to maximize the value you generate from every opportunity that makes it into your portfolio.
First, I will discuss 'minor' non-marginal investments where the amounts are still relatively small compared to the size of ABC. I'll then discuss 'major' non-marginal investments in the next section.
For minor, non-marginal impact the diagram above from the marginal impact section still applies. However, the size and determinants of the investment change (IA-IO) are different. Your funding amount won't be a pre-determined fixed amount, but rather an amount chosen based on the opportunity so as to maximize your non-marginal impact.
What we want to know is no longer how much of a shift you get for a fixed amount of investment. Rather, given that you can cause a shift in the opportunity cost curve with your investment, we want to know how much of a shift is it optimal for you to cause?
This shift will be proportional to the 'Value neglectedness' because the more neglected value you see in ABC the more you will want to unlock it.
It will be proportional to your wealth because the more you have the more capacity to take on extra risk the easier it will be for you to shift the market. The proportional change in risk you can induce will be inversely proportional to the wealth of the market ('Market wealth'). Crucially only counting as the 'market' other funders that are aware of and actively funding (or open to funding) the enterprise.
I call the ratio of IO to the market's wealth the 'Investment neglectedness'. It highlights that IO needs to be considered in the context of the wealth already available to the ABC. Also, that the more wealth that is available to ABC, the more difficult it will be for you to make a contribution.
Putting this all together:
Note that, in a change from the marginal impact value formula, the impact value now depends on the square of 'Value neglectedness' because it both determines the height and the width of the yellow, solid area.
All else equal, your impact will be small if the 'Market wealth' is big so that 'Investment neglectedness' is small. This is part of the reason for why ESG-driven investments in big companies can be expected to have limited impact (unless they ‘go viral’).
However, your impact can be big if the 'Market wealth' is small so that 'Investment neglectedness' is relatively high. For example, if the current 'market' is just a small group of early investors. This is why there are likely to be investments in early stage enterprises that have marginal impact (though scalability can be an issue when startups are still at the stage of 'doing things that don't scale').
Nevertheless, all else equal, your non-marginal impact will be greater on enterprises with more existing investment IO. This result arises because enterprises that are doing well enough to attract more investment are also more likely to hit investors' concentration risk limits and be funding constrained. They’re likely to have the ‘good problem’ of being able to come up with ways to use more funding faster than they can raise it. This means that your participation will funge with the market less and cause a greater increase in investment for such enterprises.
What if you don't see any neglected value?
Suppose you are fully aligned with the market for ABC and you fully agree with the market's assessment of value per dollar. And that you have an opportunity cost - we're considering money that you would otherwise use for a valuable purpose.
Then your net impact value will be equal to the yellow, hollow triangle (plus the small triangular portion of the yellow, solid area that overlaps with the blue, market value area). The width of this area will be approximately equal to IO. The height will be equal to the 'Change in opportunity cost' which will be approximately .
Thus, in this case
Value for comparison to standard marginal impact
The value of what I'll call the 'standard, non-equilibrium' marginal value per dollar is equal to . This ignores your opportunity costs and any consideration of your alignment with the market. The reason this can be OK is that your opportunity costs (per dollar) are unlikely to significantly depend on what investment you make. So you can compare choose between different investments simply based on their marginal value per dollar.
To compare the non-marginal impacts formulas to the non-equilibrium marginal value per dollar, we need the non-marginal formula for the same context. If we ignore opportunity costs and market alignment, then the total impact value will be equal to the sum of the yellow and red solid areas.
This area has average height approximately equal to the standard, non-equilibrium marginal value per dollar. That is, .
Its width will depend on how much it is optimal for you to invest in ABC to lower the overall market opportunity cost. You may want to invest because you see ABC is risk constrained - this generates investment shift . Or you may invest because of the neglected value - this generates .
In general, the total amount you invest in a non-marginal way, and hence the investment shift you generate, will depend on the ratio between the market's risk aversion and your risk aversion. I call this ratio the 'Risk aversion ratio'.
Putting this all together the impact value per dollar wealth is
Major non-marginal impact
The marginal case considered above ignores the fact that for investments where you see a lot of neglected value you’re going to want to invest a lot. This is going to push out other investors and make you account for a big proportion of investment in the enterprise.
If you see enough neglected value it will actually cause all other investors to exit, leaving you as the sole funder of the enterprise. This situation is illustrated in the diagram below, with IA now being the investment amount if you are the sole funder.
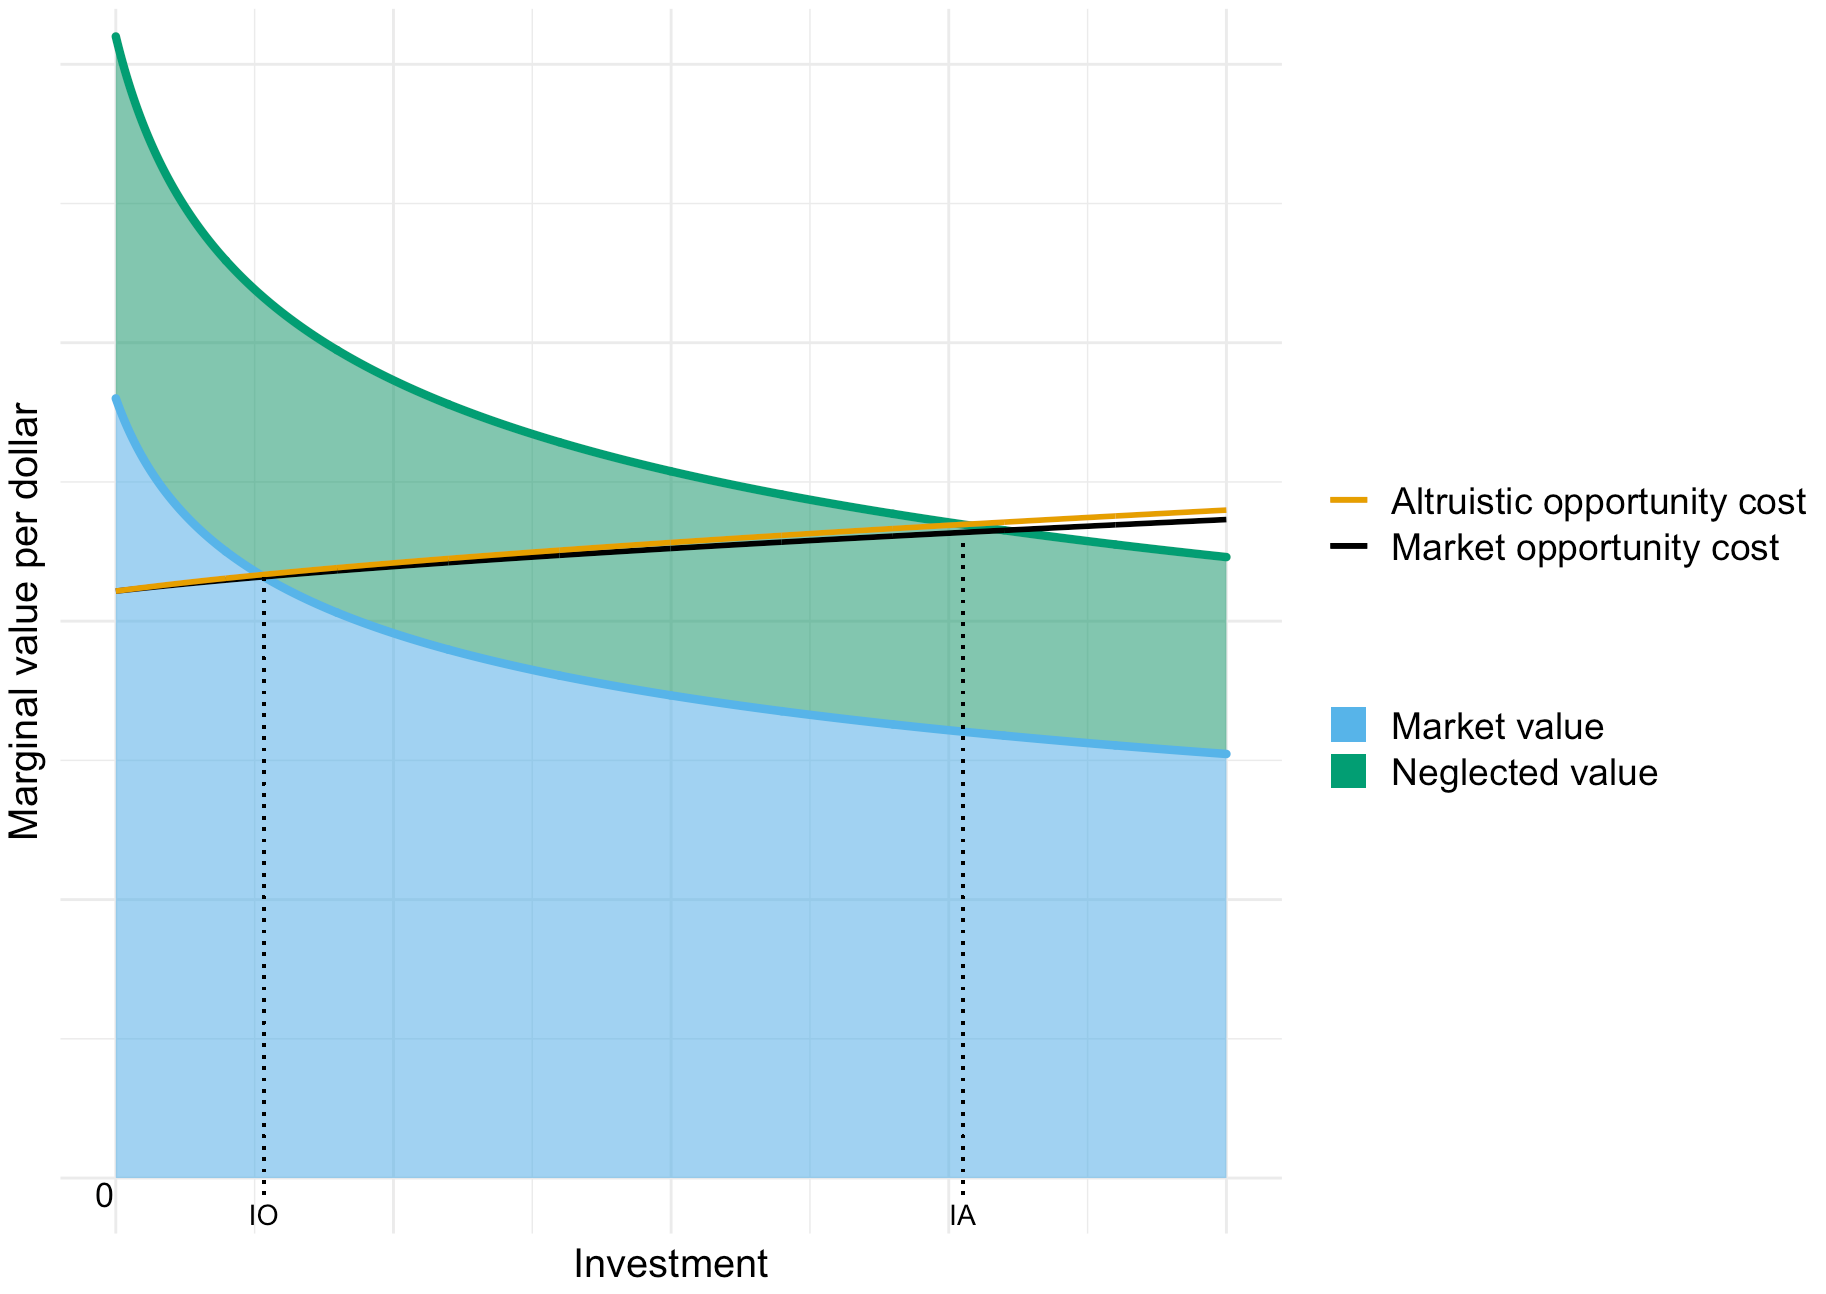
The 'altruistic opportunity cost' is the cost curve if you are investing by yourself. This could be higher or lower than that of the market depending on your risk aversion. For example, you might have the view that as an altruist you have plenty of options to spend greater wealth so you should have lower risk aversion.
Usually, the point at which concentration risk becomes significant for you will be lower than for the market (because of your relatively small size). To illustrate this, in the diagram the altruistic cost curve rises faster than the market cost curve as investment increases.
The value effects of funding ABC with amount IA are represented in the diagram below.
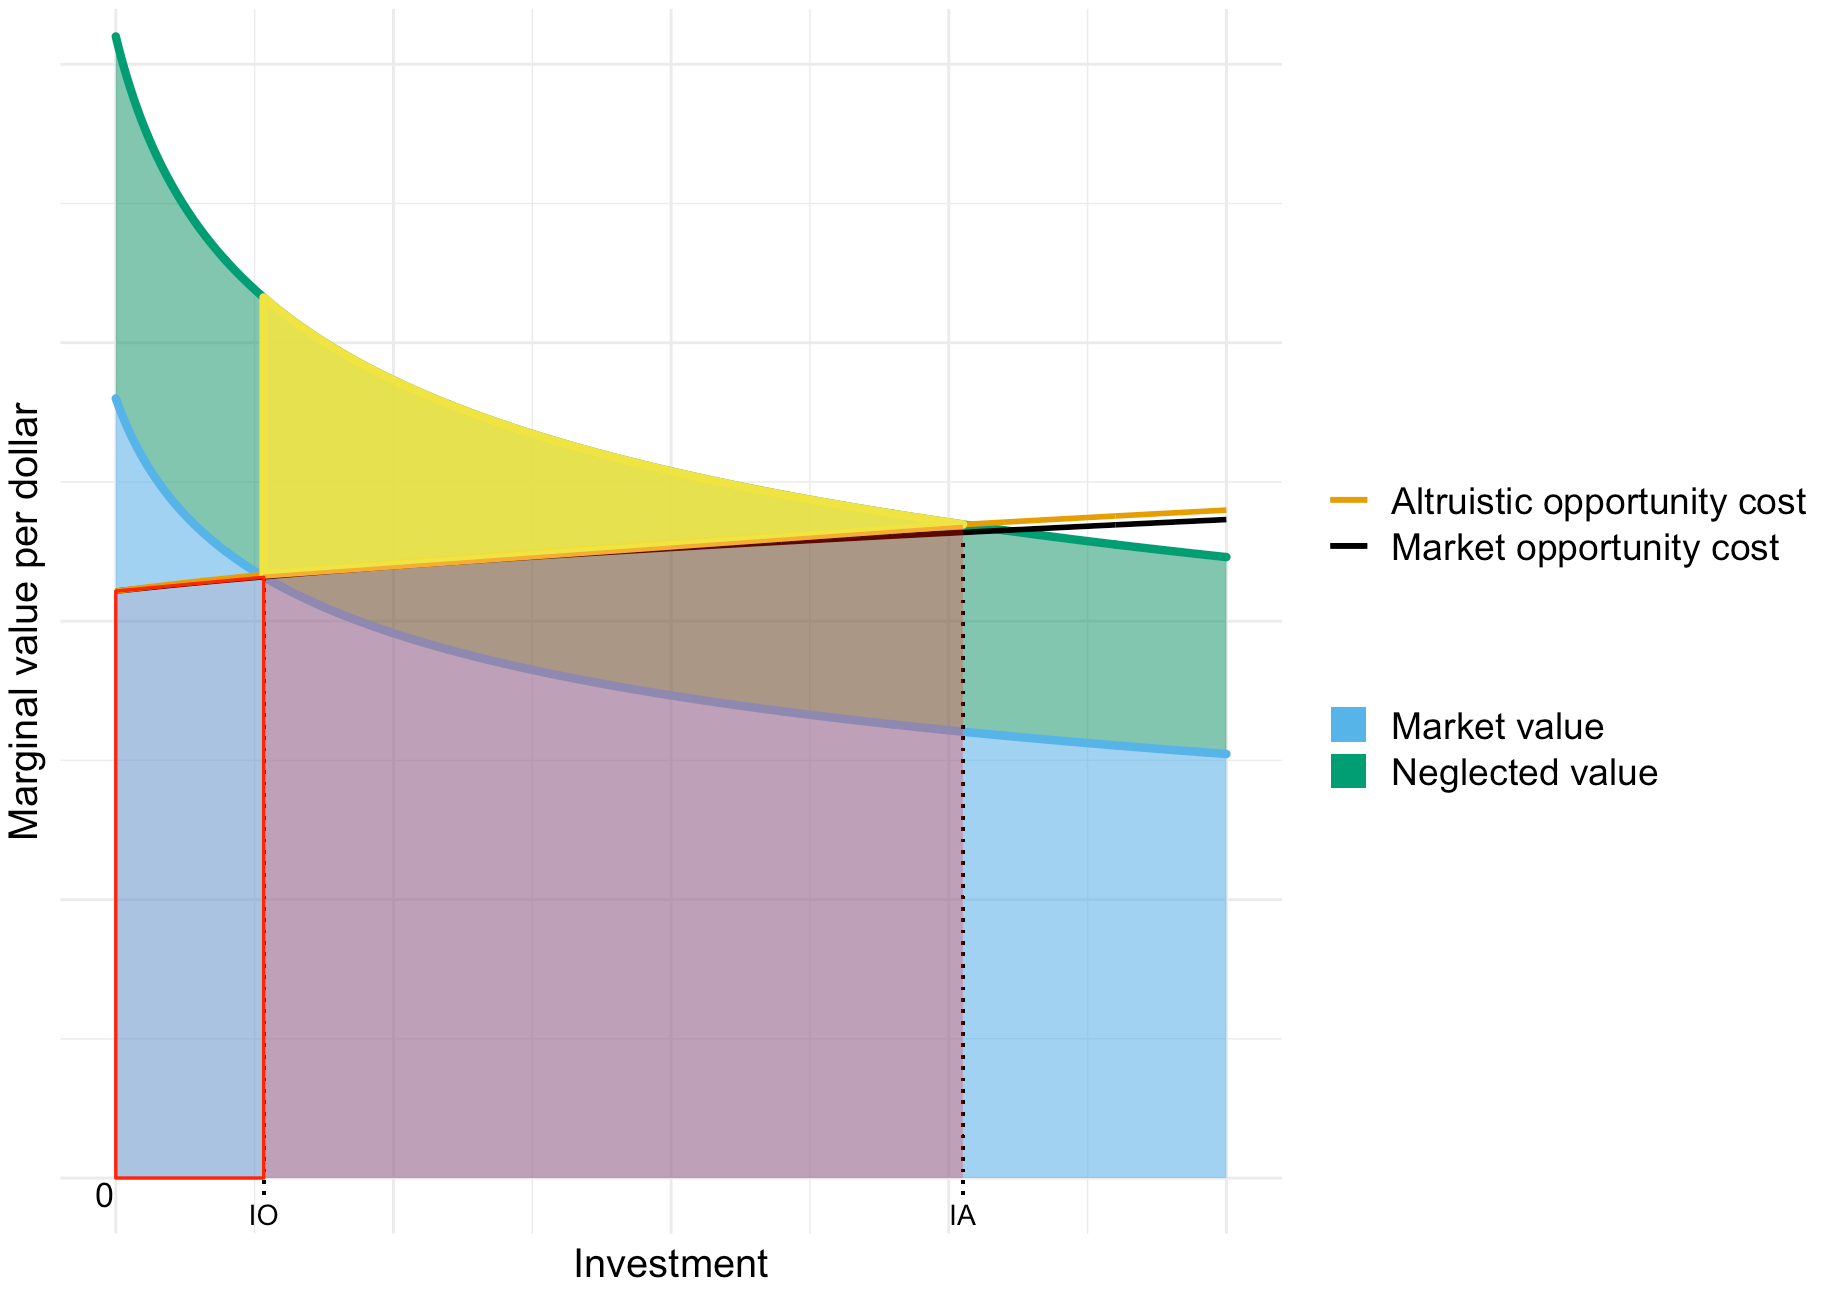
| Area | Value? |
| Solid, yellow triangle | Generally positive |
| Solid, red area | Zero to positive Depends on your opportunity costs |
| Hollow, red area | Negative to positive Depends on your opportunity costs Depends if market is aligned |
Similar to the marginal case, the value contained in the solid, yellow triangle represents the impact value that is independent of opportunity costs.
The solid, red area represents value that is offset by your opportunity costs.
The hollow, red area represents value that could be negative if you are funging with unaligned investors who won't move their funding to new investments that you value.
By pushing the other investors out of the 'market' for ABC you've made yourself the market. So we now have that . The impact value formula for this case is then the same as for the minor case except that it simplifies to:
The extra factor of 1/2 comes from the fact that the shape is now triangular, not rectangular.
So if you are willing to do something wild, to become ABC's sole funder, then you don't have to worry about equilibrium effects due to other investors working against you. In other words, your wild move guarantees you 'additionality'. With every dollar above IO you will have close to 100% additionality.
Conclusion
In this post I’ve examined a model for how to think about impact in equilibrium. The model incorporates stylized facts from both EA thinking and financial economics. Impact arises from a funder's actions changing the point where the 'value' and 'opportunity cost' curves meet.
The results highlight the importance of concepts like urgency, opportunity costs, scalability, risk, and different forms of neglectedness.
It seems important to further develop ideas such as these. Topics that I’d particularly like to highlight are:
- Forecasting future cost-effectiveness. This is important for setting one's 'urgency' and balancing grants and investing to give. My perception is that many EAs have views on this in regards to one cause area or another. But it seems like these views aren't being shared or communicated that widely. I’d love to see both more qualitative views and quantitative analyses like the those from Founders Pledge’s Climate Change Fund and Investing to Give report. Perhaps there is no need for this if most funders just want to give a fixed amount per year. But I'd be excited to see donors scaling up giving in particularly urgent times (even if just in their cause area) and taking a more patient approach when appropriate. To enable that we would need more researchers to do 'urgency' assessments for their cause area.
- Scalability. Scalability represents the 'curvature' of the value curve. It would be great to have more research which provides a clearer picture about this. Both for different types of enterprises and for different situations (e.g. in a crisis or not). Not only does this have implications for prioritization, it also seems important for determining the optimal risk aversion and leverage with investing to give. I haven’t done nor have I seen (or searched extensively for, to be honest) a literature review or meta-analysis on this topic. This would be a natural starting point for further research.
- Risk. My perception is that EA theory has neglected thinking about altruistic risk because of the principle that EA’s should be expected value maximizers. I understand the logic behind that but I think that: a) this isn’t how funders behave in practice, and b) I’m not sure this even holds in theory due to considerations like dependency risk, moral uncertainty and other considerations. Grappling with risk as a consideration seems all the more relevant if we want to undertake ambitious, non-marginal projects which almost by definition will bring with them large new risks.
If you are interested in learning more because you might like to get involved or support these developments then please contact me.
Notes
I believe that enterprise is the most neutral word for all kinds of projects, even if to some ears it has for-profit connotations. Also, I use it to align with the standard terminology in this space, such as 'enterprise impact'. And it has the same spelling in US/UK English (unlike organization). ↩︎

Thank you for posting this!
I'm interested in learning more and seeing how the framework applies in practice:
Thanks Alex.
On Angel Investing, in case you haven't seen it, there is this case study. But much more to discuss.
On Technology Deployment, are there any links you can share as examples of what you have in mind?