Gregory Lewis🔸
Bio
Mostly bio, occasionally forecasting/epistemics, sometimes stats/medicine, too often invective.
Posts 21
Comments308
I think the principal challenge for an independent investigation is getting folks with useful information to disclose it, given these people will usually (to some kind and degree) also have 'exposure' to the FTX scandal themselves.
If I was such a person I would expect working with the investigation would be unpleasant, perhaps embarrassing, plausibly acrimonious, and potentially disastrous for my reputation. What's in it for me?
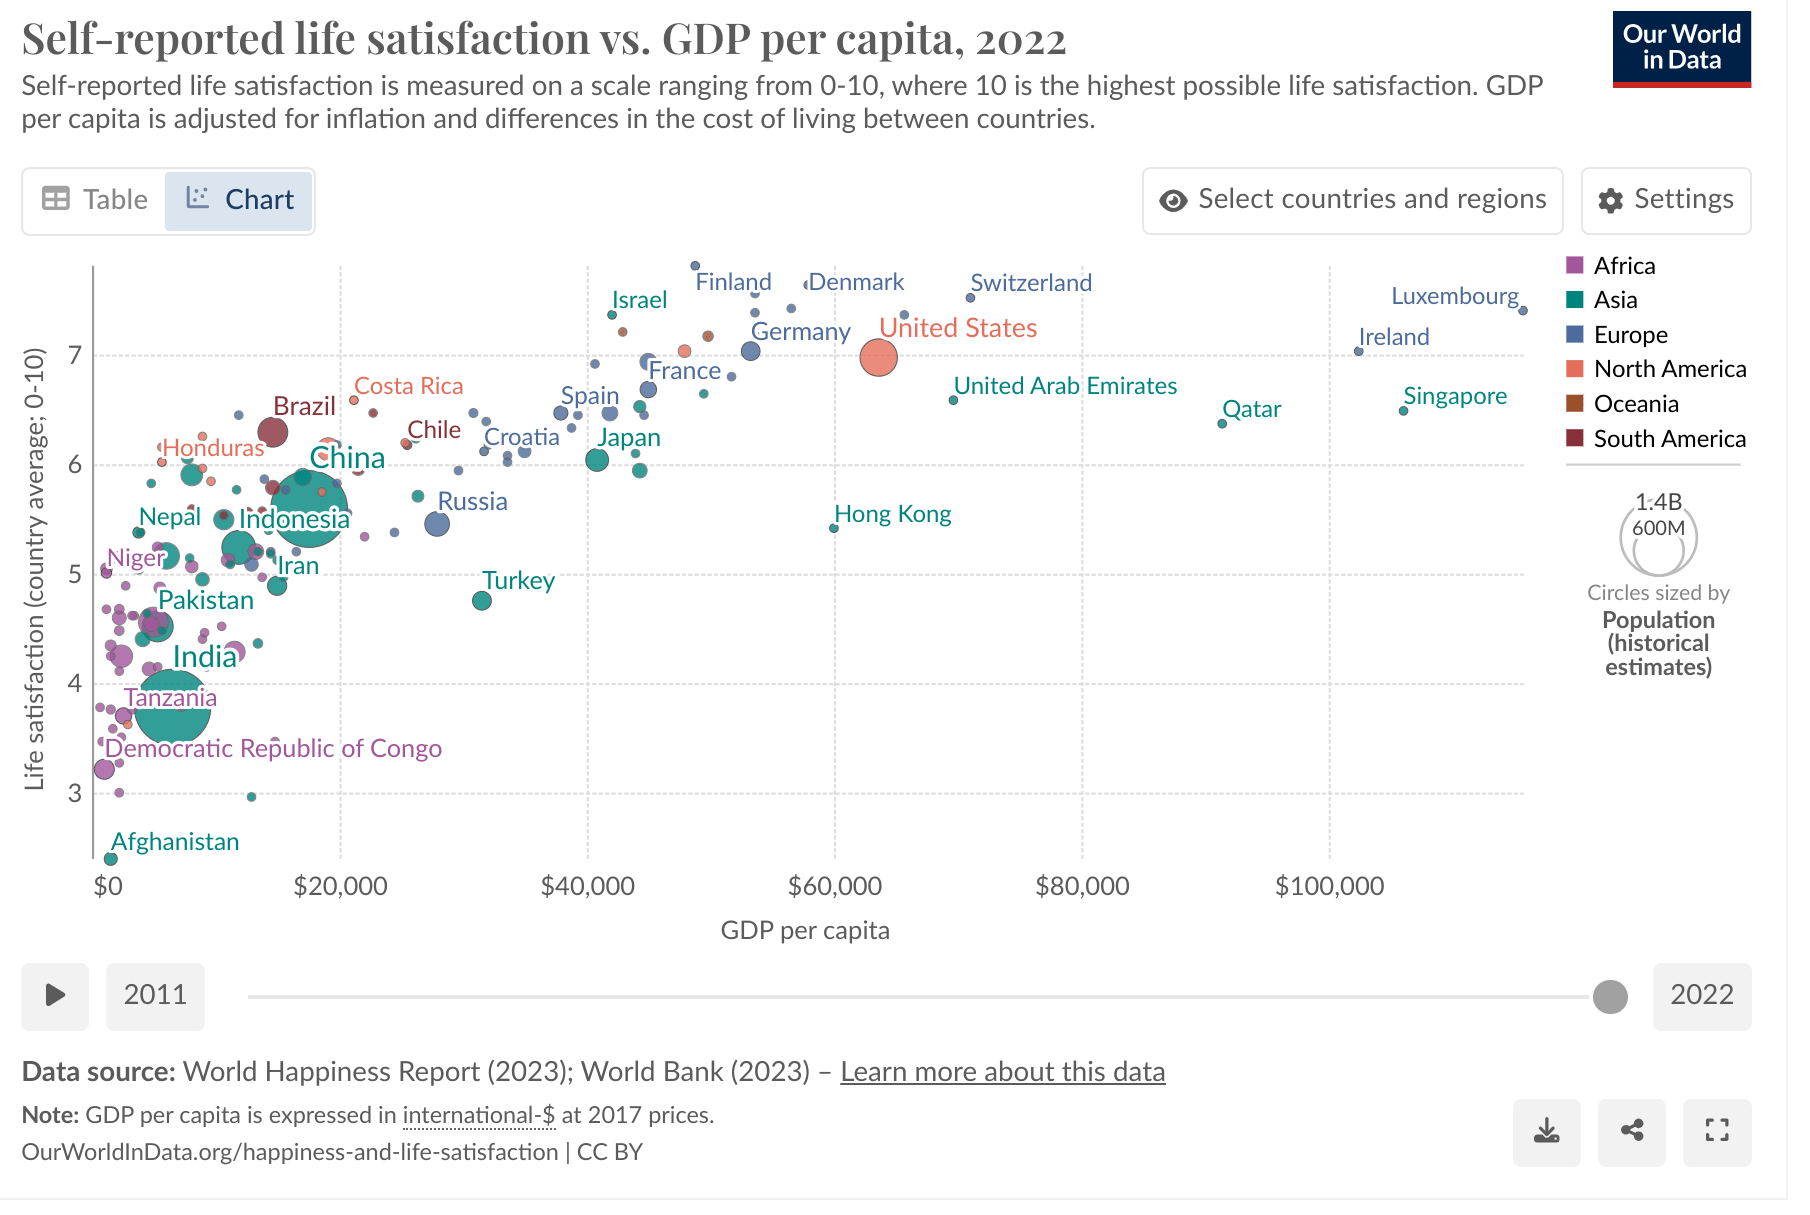
Here's the OWID charts for life satisfaction vs. GDP/capita. First linear (per the dovecote model):
Now with a log transform to GDP/capita (per the MHR):
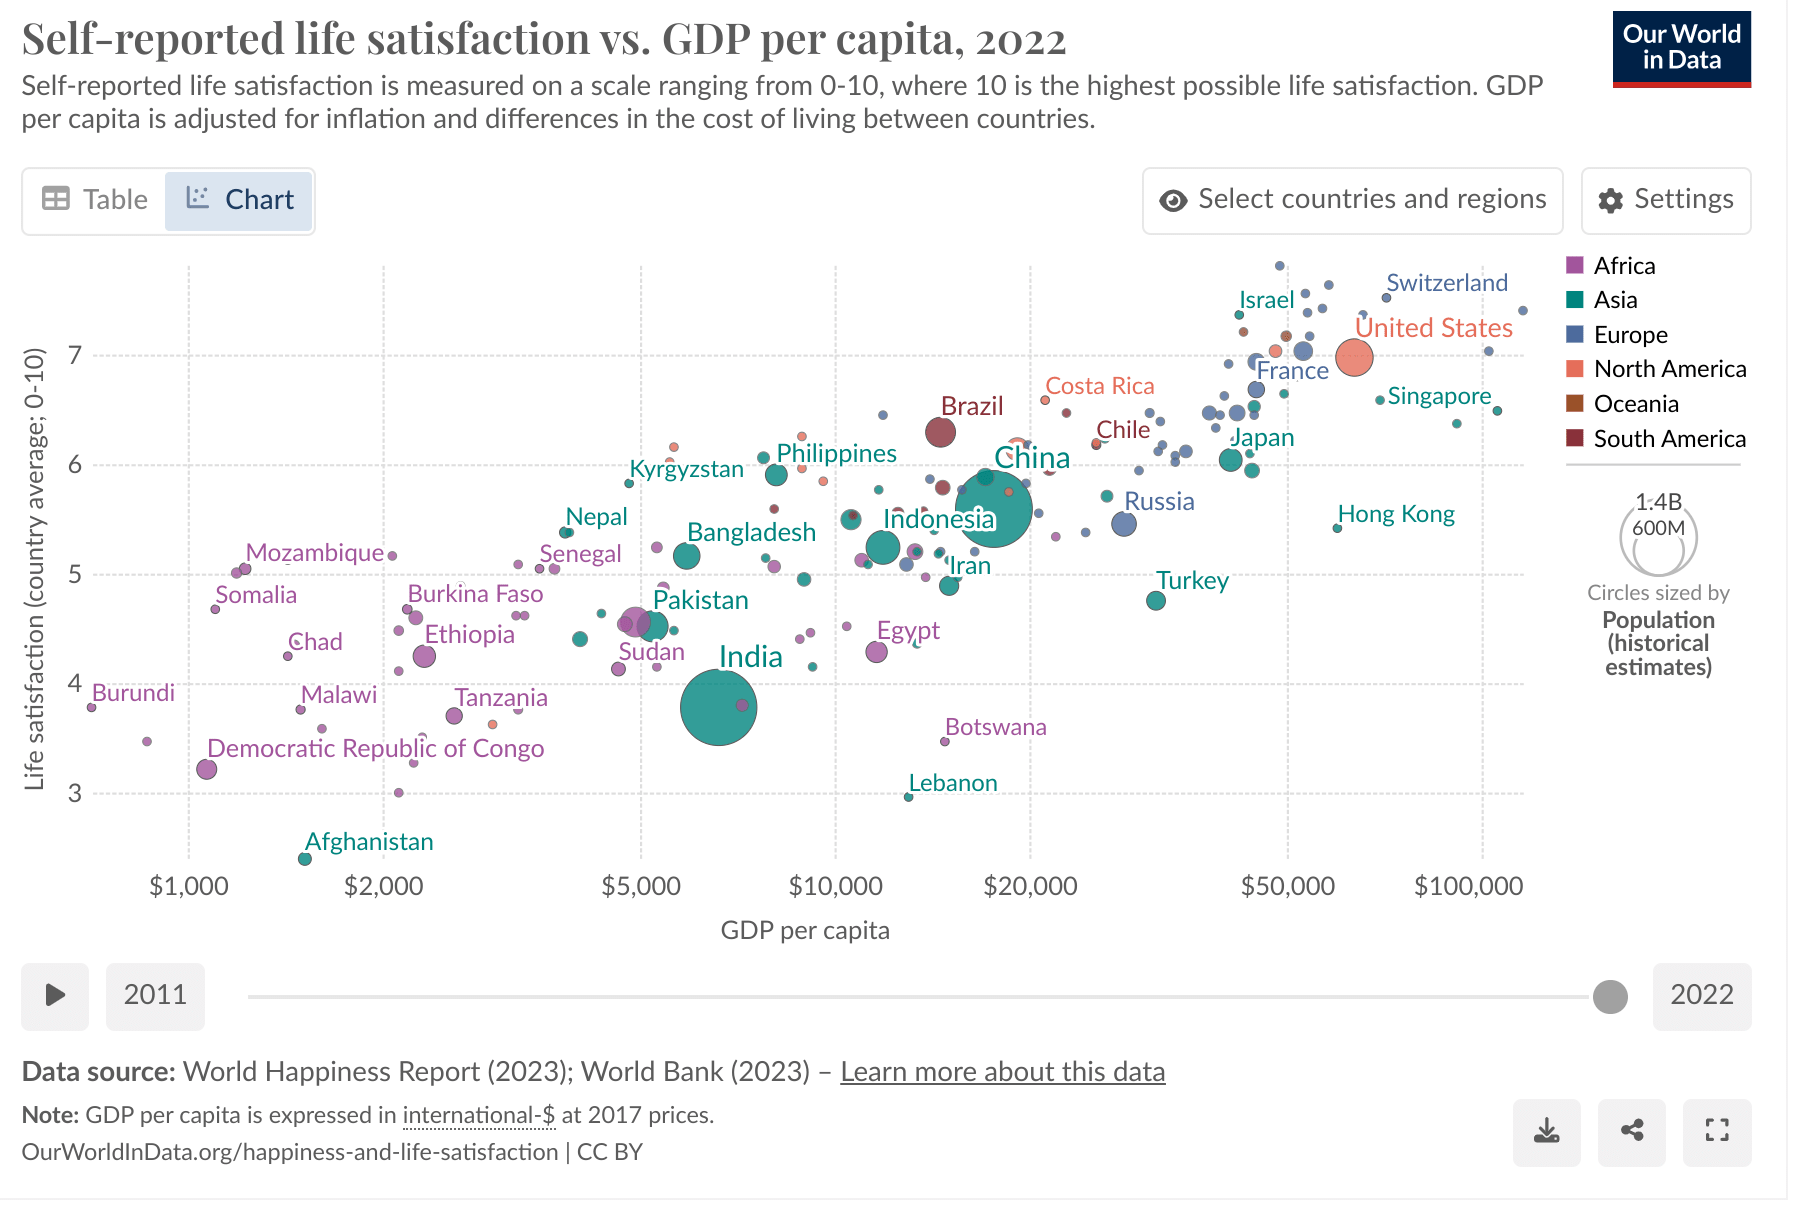
I think it is visually clear the empirical relationship is better modelled as log-linear rather than linear. Compared to this, I don't think the regression diagnostics suggesting non-inferiority of linear GDP (in the context of model selected from thousands of variables, at least some of which could log-linearly proxy for GDP, cf. Dan_Key's comment) count for much.
Besides the impact of GDP (2.5% versus 40%), I'd expect which other variables end up being selected also to be sensitive to this analysis choice. Unfortunately, as it is the wrong one, I'd expect (quasi-)omitted variable bias to distort both which variables are included, and their relative contributions, in the dovecote model.
I have previously let HLI have the last word, but this is too egregious.
Study quality: Publication bias (a property of the literature as a whole) and risk of bias (particular to each individual study which comprise it) are two different things.[1] Accounting for the former does not account for the latter. This is why the Cochrane handbook, the three meta-analyses HLI mentions here, and HLI's own protocol consider distinguish the two.
Neither Cuijpers et al. 2023 nor Tong et al. 2023 further adjust their low risk of bias subgroup for publication bias.[2] I tabulate the relevant figures from both studies below:
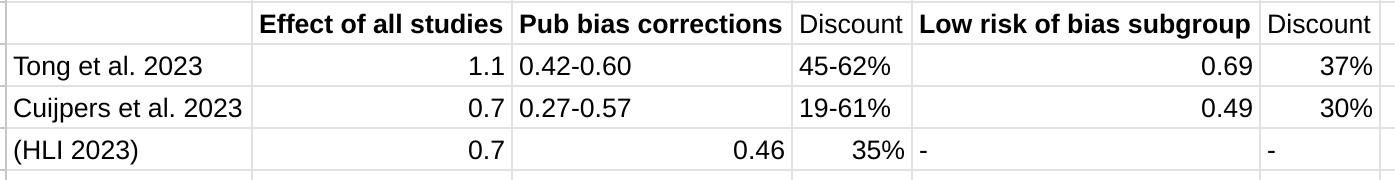
So HLI indeed gets similar initial results and publication bias adjustments to the two other meta-analyses they find. Yet - although these are not like-for-like - these other two meta-analyses find similarly substantial effect reductions when accounting for study quality as they do when assessing at publication bias of the literature as a whole.
There is ample cause for concern here:[3]
- Although neither of these studies 'adjust for both', one later mentioned - Cuijpers et al. 2020 - does. It finds an additional discount to effect size when doing so.[4] So it suggests that indeed 'accounting for' publication bias does not adequately account for risk of bias en passant.
- Tong et al. 2023 - the meta-analysis expressly on PT in LMICs rather than PT generally - finds higher prevalence of indicators of lower study quality in LMICs, and notes this as a competing explanation for the outsized effects.[5]
- As previously mentioned, in the previous meta-analysis, unregistered trials had a 3x greater effect size than registered ones. All trials on Strongminds published so far have not been registered. Baird et al., which is registered, is anticipated to report disappointing results.
Evidentiary standards: Indeed, the report drew upon a large number of studies. Yet even a synthesis of 72 million (or whatever) studies can be misleading if issues of publication bias, risk of bias in individual studies (and so on) are not appropriately addressed. That an area has 72 (or whatever) studies upon it does not mean it is well-studied, nor would this number (nor any number) be sufficient, by itself, to satisfy any evidentiary standard.
Outlier exclusion: The report's approach to outlier exclusion is dissimilar to both Cuijpers et al. 2020 and Tong et al. 2023, and further is dissimilar with respect to features I highlighted as major causes for concern re. HLI's approach in my original comment.[6] Specifically:
- Both of these studies present the analysis with the full data first in their results. Contrast HLI's report, where only the results with outliers excluded are presented in the main results, and the analysis without exclusion is found only in the appendix.[7]
- Both these studies also report the results with the full data as their main findings (e.g. in their respective abstracts). Cuijpers et al. mentions their outlier excluded results primarily in passing ("outliers" appears once in the main text); Tong et al. relegates a lot of theirs to the appendix. HLI's report does the opposite. (cf. fn 7 above)
- Only Tong et al. does further sensitivity analysis on the 'outliers excluded' subgroup. As Jason describes, this is done alongside the analysis where all data included, the qualitative and quantitative differences which result from this analysis choice are prominently highlighted to the reader and extensively discussed. In HLI's report, by contrast, the factor of 3 reduction to ultimate effect size when outliers are not excluded is only alluded to qualitatively in a footnote (fn 33)[8] of the main report's section (3.2) arguing why outliers should be excluded, not included in the reports sensitivity analysis, and only found in the appendix.[9]
- Both studies adjust for publication bias only on all data, not on data with outliers excluded, and these are the publication bias findings they present. Contrast HLI's report.
The Cuijpers et al. 2023 meta-analysis previously mentioned also differs in its approach to outlier exclusion from HLI's report in the ways highlighted above. The Cochrane handbook also supports my recommendations on what approach should be taken, which is what the meta-analyses HLI cites approvingly as examples of "sensible practice" actually do, but what HLI's own work does not.
The reports (non) presentation of the stark quantitative sensitivity of its analysis - material to its report bottom line recommendations - to whether outliers are excluded is clearly inappropriate. It is indefensible if, as I have suggested may be the case, the analysis with outliers included was indeed the analysis first contemplated and conducted.[10] It is even worse if it was the publication bias corrections on the full data was what in fact prompted HLI to start making alternative analysis choices which happened to substantially increase the bottom line figures.
Bayesian analysis: Bayesian methods notoriously do not avoid subjective inputs - most importantly here, what information we attend to when constructing an 'informed prior' (or, if one prefers, how to weigh the results with a particular prior stipulated).
In any case, they provide no protection from misunderstanding the calculation being performed, and so misinterpreting the results. The Bayesian method in the report is actually calculating the (adjusted) average effect size of psychotherapy interventions in general, not the expected effect of a given psychotherapy intervention. Although a trial on Strongminds which shows it is relatively ineffectual should not update our view much the efficacy of psychotherapy interventions (/similar to Strongminds) as a whole, it should update us dramatically on the efficacy of Strongminds itself.
Although as a methodological error this is a subtle one (at least, subtle enough for me not to initially pick up on it), the results it gave are nonsense to the naked eye (e.g. SM would still be held as a GiveDirectly-beating intervention even if there were multiple high quality RCTs on Strongminds giving flat or negative results). HLI should have seen this themselves, should have stopped to think after I highlighted these facially invalid outputs of their method in early review, and definitely should not be doubling down on these conclusions even now.
Making recommendations: Although there are other problems, those I have repeated here make the recommendations of the report unsafe. This is why I recommended against publication. Specifically:
- Although I don't think the Bayesian method the report uses would be appropriate, if it was calculated properly on its own terms (e.g. prediction intervals not confidence intervals to generate the prior, etc.), and leaving everything else the same, the SM bottom line would drop (I'm pretty sure) by a factor a bit more than 2.
- The results are already essentially sensitive to whether outliers are excluded in analysis or not: SM goes from 3.7x -> ~1.1x GD on the back of my envelope, again leaving all else equal.
(1) and (2) combined should net out to SM < GD; (1) or (2) combined with some of the other sensitivity analyses (e.g. spillovers) will also likely net out to SM < GD. Even if one still believes the bulk of (appropriate) analysis paths still support a recommendation, this sensitivity should be made transparent.
- ^
E.g. Even if all studies in the field are conducted impeccably, if journals only accept positive results the literature may still show publication bias. Contrariwise, even if all findings get published, failures in allocation/blinding/etc. could lead to systemic inflation of effect sizes across the literature. In reality - and here - you often have both problems, and they only partially overlap.
- ^
Jason correctly interprets Tong et al. 2023: the number of studies included in their publication bias corrections (117 [+36 w/ trim and fill]) equals the number of all studies, not the low risk of bias subgroup (36 - see table 3). I do have access to Cuijpers et al. 2023, which has a very similar results table, with parallel findings (i.e. they do their publication bias corrections on the whole set of studies, not on a low risk of bias subgroup).
- ^
Me, previously:
HLI's report does not assess the quality of its included studies, although it plans to do so. I appreciate GRADEing 90 studies or whatever is tedious and time consuming, but skipping this step to crack on with the quantitative synthesis is very unwise: any such synthesis could be hugely distorted by low quality studies.
- ^
From their discussion (my emphasis):
Risk of bias is another important problem in research on psychotherapies for depression. In 70% of the trials (92/309) there was at least some risk of bias. And the studies with low risk of bias, clearly indicated smaller effect sizes than the ones that had (at least some) risk of bias. Only four of the 15 specific types of therapy had 5 or more trials without risk of bias. And the effects found in these studies were more modest than what was found for all studies (including the ones with risk of bias). When the studies with low risk of bias were adjusted for publication bias, only two types of therapy remained significant (the “Coping with Depression” course, and self-examination therapy).
- ^
E.g. from the abstract (my emphasis):
The larger effect sizes found in non-Western trials were related to the presence of wait-list controls, high risk of bias, cognitive-behavioral therapy, and clinician-diagnosed depression (p < 0.05). The larger treatment effects observed in non-Western trials may result from the high heterogeneous study design and relatively low validity. Further research on long-term effects, adolescent groups, and individual-level data are still needed.
- ^
Apparently, all that HLI really meant with "Excluding outliers is thought sensible practice here; two related meta-analyses, Cuijpers et al., 2020c; Tong et al., 2023, used a similar approach" [my emphasis] was merely "[C]onditional on removing outliers, they identify a similar or greater range of effect sizes as outliers as we do." (see).
Yeah, right.
I also had the same impression as Jason that HLI's reply repeatedly strawmans me. The passive aggressive sniping sprinkled throughout and subsequent backpedalling (in fairness, I suspect by people who were not at the keyboard of the corporate account) is less than impressive too. But it's nearly Christmas, so beyond this footnote I'll let all this slide.
- ^
Me again (my [re-?]emphasis)
Received opinion is typically that outlier exclusion should be avoided without a clear rationale why the 'outliers' arise from a clearly discrepant generating process. If it is to be done, the results of the full data should still be presented as the primary analysis
- ^
Said footnote:
If we didn’t first remove these outliers, the total effect for the recipient of psychotherapy would be much larger (see Section 4.1) but some publication bias adjustment techniques would over-correct the results and suggest the completely implausible result that psychotherapy has negative effects (leading to a smaller adjusted total effect). Once outliers are removed, these methods perform more appropriately. These methods are not magic detectors of publication bias. Instead, they make inferences based on patterns in the data, and we do not want them to make inferences on patterns that are unduly influenced by outliers (e.g., conclude that there is no effect – or, more implausibly, negative effects – of psychotherapy because of the presence of unreasonable effects sizes of up to 10 gs are present and creating large asymmetric patterns). Therefore, we think that removing outliers is appropriate. See Section 5 and Appendix B for more detail.
The sentence in the main text this is a footnote to says:
Removing outliers this way reduced the effect of psychotherapy and improves the sensibility of moderator and publication bias analyses.
- ^
Me again:
[W]ithout excluding data, SM drops from ~3.6x GD to ~1.1x GD. Yet it doesn't get a look in for the sensitivity analysis, where HLI's 'less favourable' outlier method involves taking an average of the other methods (discounting by ~10%), but not doing no outlier exclusion at all (discounting by ~70%).
- ^
My remark about "Even if you didn't pre-specify, presenting your first cut as the primary analysis helps for nothing up my sleeve reasons" which Dwyer mentions elsewhere was a reference to 'nothing up my sleeve numbers' in cryptography. In the same way picking pi or e initial digits for arbitrary constants reassures the author didn't pick numbers with some ulterior purpose they are not revealing, reporting what one's first analysis showed means readers can compare it to where you ended up after making all the post-hoc judgement calls in the garden of forking paths. "Our first intention analysis would give x, but we ended up convincing ourselves the most appropriate analysis gives a bottom line of 3x" would rightly arouse a lot of scepticism.
I've already mentioned I suspect this is indeed what has happened here: HLI's first cut was including all data, but argued itself into making the choice to exclude, which gave a 3x higher 'bottom line'. Beyond "You didn't say you'd exclude outliers in your protocol" and "basically all of your discussion in the appendix re. outlier exclusion concerns the results of publication bias corrections on the bottom line figures", I kinda feel HLI not denying it is beginning to invite an adverse inference from silence. If I'm right about this, HLI should come clean.
So the problem I had in mind was in the parenthetical in my paragraph:
To its credit, the write-up does highlight this, but does not seem to appreciate the implications are crazy: any PT intervention, so long as it is cheap enough, should be thought better than GD, even if studies upon it show very low effect size (which would usually be reported as a negative result, as almost any study in this field would be underpowered to detect effects as low as are being stipulated)
To elaborate: the actual data on Strongminds was a n~250 study by Bolton et al. 2003 then followed up by Bass et al. 2006. HLI models this in table 19:
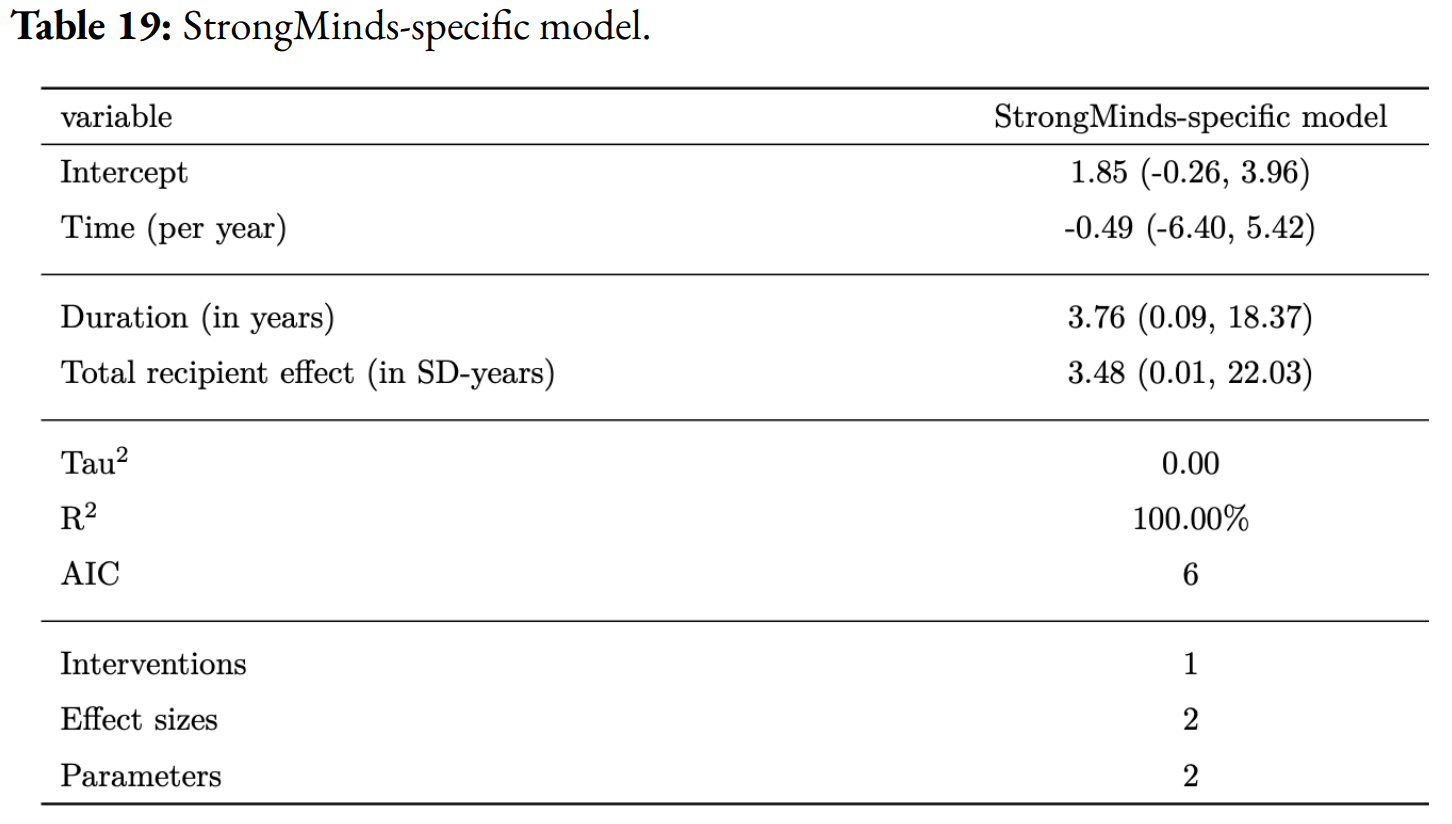
So an initial effect of g = 1.85, and a total impact of 3.48 WELLBYs. To simulate what the SM data will show once the (anticipated to be disappointing) forthcoming Baird et al. RCT is included, they discount this[1] by a factor of 20.
Thus the simulated effect size of Bolton and Bass is now ~0.1. In this simulated case, the Bolton and Bass studies would be reporting negative results, as they would not be powered to detect an effect size as small as g = 0.1. To benchmark, the forthcoming Baird et al. study is 6x larger than these, and its power calculations have minimal detectable effects g = 0.1 or greater.
Yet, apparently, in such a simulated case we should conclude that Strongminds is fractionally better than GD purely on the basis of two trials reporting negative findings, because numerically the treatment groups did slightly (but not significantly) better than the control ones.
Even if in general we are happy with 'hey, the effect is small, but it is cheap, so it's a highly cost-effective intervention', we should not accept this at the point when 'small' becomes 'too small to be statistically significant'. Analysis method + negative findings =! fractionally better in expectation vs. cash transfers, so I take it as diagnostic the analysis is going wrong.
- ^
I think 'this' must be the initial effect size/intercept, as 3.48 * 0.05 ~ 1.7 not 3.8. I find this counter-intuitive, as I think the drop in total effect should be super not sub linear with intercept, but ignore that.
(@Burner1989 @David Rhys Bernard @Karthik Tadepalli)
I think the fundamental point (i.e. "You cannot use the distribution for the expected value of an average therapy treatment as the prior distribution for a SPECIFIC therapy treatment, as there will be a large amount of variation between possible therapy treatments that is missed when doing this.") is on the right lines, although subsequent discussion of fixed/random effect models might confuse the issue. (Cf. my reply to Jason).
The typical output of a meta-analysis is an (~) average effect size estimate (the diamond at the bottom of the forest plot, etc.) The confidence interval given for that is (very roughly)[1] the interval we predict the true average effect likely lies. So for the basic model given in Section 4 of the report, the average effect size is 0.64, 95% CI (0.54 - 0.74). So (again, roughly) our best guess of the 'true' average effect size of psychotherapy in LMICs from our data is 0.64, and we're 95% sure(*) this average is somewhere between (0.54, 0.74).
Clearly, it is not the case that if we draw another study from the same population, we should be 95% confident(*) the effect size of this new data point will lie between 0.54 to 0.74. This would not be true even in the unicorn case there's no between study heterogeneity (e.g. all the studies are measuring the same effect modulo sampling variance), and even less so when this is marked, as here. To answer that question, what you want is a prediction interval.[2] This interval is always wider, and almost always significantly so, than the confidence interval for the average effect: in the same analysis with the 0.54-0.74 confidence interval, the prediction interval was -0.27 to 1.55.
Although the full model HLI uses in constructing informed priors is different from that presented in S4 (e.g. it includes a bunch of moderators), they appear to be constructed with monte carlo on the confidence intervals for the average, not the prediction interval for the data. So I believe the informed prior is actually one of the (adjusted) "Average effect of psychotherapy interventions as a whole", not a prior for (e.g.) "the effect size reported in a given PT study." The latter would need to use the prediction intervals, and have a much wider distribution.[3]
I think this ably explains exactly why the Bayesian method for (e.g.) Strongminds gives very bizarre results when deployed as the report does, but they do make much more sense if re-interpreted as (in essence) computing the expected effect size of 'a future strongminds-like intervention', but not the effect size we should believe StrongMinds actually has once in receipt of trial data upon it specifically. E.g.:
- The histogram of effect sizes shows some comparisons had an effect size < 0, but the 'informed prior' suggests P(ES < 0) is extremely low. As a prior for the effect size of the next study, it is much too confident, given the data, a trial will report positive effects (you have >1/72 studies being negative, so surely it cannot be <1%, etc.). As a prior for the average effect size, this confidence is warranted: given the large number of studies in our sample, most of which report positive effects, we would be very surprised to discover the true average effect size is negative.
- The prior doesn't update very much on data provided. E.g. When we stipulate the trials upon strongminds report a near-zero effect of 0.05 WELLBYs, our estimate of 1.49 WELLBYS goes to 1.26: so we should (apparently) believe in such a circumstance the efficacy of SM is ~25 times greater than the trial data upon it indicates. This is, obviously, absurd. However, such a small update is appropriate if it were to ~the average of PT interventions as a whole: that we observe a new PT intervention has much below average results should cause our average to shift a little towards the new findings, but not much.
In essence, the update we are interested in is not "How effective should we expect future interventions like Strongminds are given the data on Strongminds efficacy", but simply "How effective should we expect Strongminds is given the data on how effective Strongminds is". Given the massive heterogeneity and wide prediction interval, the (correct) informed prior is pretty uninformative, as it isn't that surprised by anything in a very wide range of values, and so on finding trial data on SM with a given estimate in this range, our estimate should update to match it pretty closely.[4]
(This also should mean, unlike the report suggests, the SM estimate is not that 'robust' to adverse data. Eyeballing it, I'd guess the posterior should be going down by a factor of 2-3 conditional on the stipulated data versus currently reported results).
- ^
I'm aware confidence intervals are not credible intervals, and that 'the 95% CI tells you where the true value is with 95% likelihood' strictly misinterprets what a confidence interval is, etc. (see) But perhaps 'close enough', so I'm going to pretend these are credible intervals, and asterisk each time I assume the strictly incorrect interpretation.
- ^
Cf. Cochrane:
The summary estimate and confidence interval from a random-effects meta-analysis refer to the centre of the distribution of intervention effects, but do not describe the width of the distribution. Often the summary estimate and its confidence interval are quoted in isolation and portrayed as a sufficient summary of the meta-analysis. This is inappropriate. The confidence interval from a random-effects meta-analysis describes uncertainty in the location of the mean of systematically different effects in the different studies. It does not describe the degree of heterogeneity among studies, as may be commonly believed. For example, when there are many studies in a meta-analysis, we may obtain a very tight confidence interval around the random-effects estimate of the mean effect even when there is a large amount of heterogeneity. A solution to this problem is to consider a prediction interval (see Section 10.10.4.3).
- ^
Although I think the same mean, so it will give the right 'best guess' initial estimates.
- ^
Obviously, modulo all the other issues I suggest with both the meta-analysis as a whole, that we in fact would incorporate other sources of information into our actual prior, etc. etc.
What prior to formally pick is tricky - I agree the factors you note would be informative, but how to weigh them (vs. other sources of informative evidence) could be a matter of taste. However, sources of evidence like this could be handy to use as 'benchmarks' to see whether the prior (/results of the meta-analysis) are consilient with them, and if not, explore why.
But I think I can now offer a clearer explanation of what is going wrong. The hints you saw point in this direction, although not quite as you describe.
One thing worth being clear on is HLI is not updating on the actual SM specific evidence. As they model it, the estimated effect on this evidence is an initial effect of g = 1.8, and a total effect of ~3.48 WELLBYs, so this would lie on the right tail, not the left, of the informed prior.[1] They discount the effect by a factor of 20 to generate the data they feed into their Bayesian method. Stipulating data which would be (according to their prior) very surprisingly bad would be in itself a strength, not a concern, of the conservative analysis they are attempting.
Next, we need to distinguish an average effect size from a prediction interval. The HLI does report both (Section 4) for a more basic model of PT in LMICs. The (average, random) effect size is 0.64 (95% CI 0.54 to 0.74), whilst the prediction interval is -0.27 to 1.55. The former is giving you the best guess of the average effect (with a confidence interval), the latter is telling you - if I do another study like those already included, the range I can expect its effect size to be within. By loose analogy: if I sample 100 people and their average height is roughly 5' 7" (95% CI 5'6" to 5'8"), the 95% range of the individual heights will range much more widely (say 5' 0" to 6' 2")
Unsurprisingly (especially given the marked heterogeneity), the prediction interval is much wider than the confidence interval around the average effect size. Crucially, if our 'next study' reports an effect size of (say) 0.1, our interpretation typically should not be: "This study can't be right, the real effect of the intervention it studies must be much closer to 0.6". Rather, as findings are heterogeneous, it is much more likely a study which (genuinely) reports a below average effect.[2] Back to the loose analogy, we would (typically) assume we got it right if we measured some more people at (e.g.) 6'0" and 5'4", even though these are significantly above or below the 95% confidence interval of our average, and only start to doubt measurements much outside our prediction interval (e.g. 3'10", 7'7").
Now the problem with the informed prior becomes clear: it is (essentially) being constructed with confidence intervals of the average, not prediction intervals for its data from its underlying models. As such, it is a prior not of "What is the expected impact of a given PT intervention", but rather "What is the expected average impact of PT interventions as a whole".[3]
With this understanding, the previously bizarre behaviour is made sensible. For the informed prior should assign very little credence to the average impact of PT overall being ~0.4 per the stipulated Strongminds data, even though it should not be that surprised that a particular intervention (e.g. Strongminds!) has an impact much below average, as many other PT interventions studied also do (cf. Although I shouldn't be surprised if I measure someone as 5'2", I should be very surprised if the true average height is actually 5'2", given my large sample averages 5'7"). Similarly, if we are given a much smaller additional sample reporting a much different effect size, the updated average effect should remain pretty close to the prior (e.g. if a handful of new people have heights < 5'4", my overall average goes down a little, but not by much).
Needless to say, the results of such an analysis, if indeed for "average effect size of psychotherapy as a whole" are completely inappropriate for "expected effect size of a given psychotherapy intervention", which is the use it is put to in the report.[4] If the measured effect size of Strongminds was indeed ~0.4, the fact psychotherapy interventions ~average substantially greater effects of ~1.4 gives very little reason to conclude the effect of Strongminds is in fact much higher (e.g. ~1.3). In the same way, if I measure your height is 5'0", the fact the average heights of other people I've measured is 5'7" does not mean I should conclude you're probably about 5'6".[5]
- ^
Minor: it does lie pretty far along the right tail of the prior (<top 1st percentile?), so maybe one could be a little concerned. Not much, though: given HLI was searching for particularly effective PT interventions in the literature, it doesn't seem that surprising that this effort could indeed find one at the far-ish right tail of apparent efficacy.
- ^
One problem for many types of the examined psychotherapy is that the level of heterogeneity was high, and many of the prediction intervals were broad and included zero. This means that it is difficult to predict the effect size of the next study that is done with this therapy, and that study may just as well find negative effects. The resulting effect sizes differ so much for one type of therapy, that it cannot be reliably predicted what the true effect size is.
- ^
Cf. your original point about a low result looking weird given the prior. Perhaps the easiest way to see this is to consider a case where the intervention is harmful. The informed prior says P (ES < 0) is very close to zero. Yet >1/72 studies in the sample did have an effect size < 0. So obviously a prior of an intervention should not be that confident in predicting it will not have a -ve effect. But a prior of the average effect of PT interventions should be that confident this average is not in fact negative, given the great majority of sampled studies show substantially +ve effects.
- ^
In a sense, the posterior is not computing the expected effect of StrongMinds, but rather the expected effect of a future intervention like StrongMinds. Somewhat ironically, this (again, simulated) result would be best interpreted as an anti-recommendation: Strongminds performs much below the average we would expect of interventions similar to it.
- ^
It is slightly different for measured height as we usually have very little pure measurement error (versus studies with more significant sampling variance). So you'd update a little less towards the reported study effects vs. the expected value than you would for height measurements vs. the average. But the key points still stand.
HLI kindly provided me with an earlier draft of this work to review a couple of weeks ago. Although things have gotten better, I noted what I saw as major problems with the draft as-is, and recommended HLI take its time to fix them - even though this would take a while, and likely miss the window of Giving Tuesday.
Unfortunately, HLI went ahead anyway with the problems I identified basically unaddressed. Also unfortunately (notwithstanding laudable improvements elsewhere) these problems are sufficiently major I think potential donors are ill-advised to follow the recommendations and analysis in this report.
In essence:
- Issues of study quality loom large over this literature, with a high risk of materially undercutting the results (they did last time). The reports interim attempts to manage these problems are inadequate.
- Pub bias corrections are relatively mild, but only when all effects g > 2 are excluded from the analysis - they are much starker (albeit weird) if all data is included. Due to this, the choice to exclude 'outliers' roughly trebles the bottom line efficacy of PT. This analysis choice is dubious on its own merits, was not pre-specified in the protocol, yet is only found in the appendix rather than the sensitivity analysis in the main report.
- The bayesian analysis completely stacks the deck in favour of psychotherapy interventions (i.e. an 'informed prior' which asserts one should be > 99% confident strongminds is more effective than givedirectly before any data on strongminds is contemplated), such that psychotherapy/strongminds/etc, getting recommended is essentially foreordained.
Study quality
It perhaps comes as little surprise that different studies on psychotherapy in LMICs report very different results:[1]
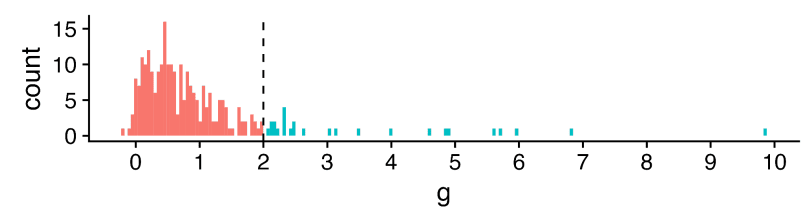
The x-axis is a standardized measure of effect size for psychotherapy in terms of wellbeing.[2] Most - but not all - show a positive effect (g > 0), but the range is vast, HLI excludes effect sizes over 2 as outliers (much more later), but 2 is already a large effect: to benchmark, it is roughly the height difference between male and female populations.
Something like an '(weighted) average effect size' across this set would look promising (~0.6) - to also benchmark, the effect size of cash transfers on (individual) wellbeing is ~0.1. Yet cash transfers (among many other interventions) have much less heterogeneous results: more like "0.1 +/- 0.1", not ~"0.6 multiply-or-divide by an integer". It seems important to understand what is going on.
One hope would be this heterogeneity can be explained in terms of the intervention and length of follow-up. Different studies did (e.g.) different sorts of psychotherapy, did more or less of it, and measured the outcomes at different points afterwards. Once we factor these things in to our analysis, this wide distribution seen when looking at the impact of psychotherapy in general sharpens into a clearer picture for any particular psychotherapeutic intervention. One can then deploy this knowledge to assess - in particular - the likely efficacy of a charity like Strongminds.
The report attempts this enterprise in section 4 of the report. I think a fair bottom line is despite these efforts, the overall picture is still very cloudy: the best model explains ~12% of the variance in effect sizes. But this best model is still better than no model (but more later), so one can still use it to make a best guess for psychotherapeutic interventions, even if there remains a lot of uncertainty and spread.
But there could be another explanation for why there's so much heterogeneity: there are a lot of low-quality studies, and low quality studies tend to report inflated effect sizes. In the worst case, the spread of data suggesting psychotherapy's efficacy is instead a mirage, and the effect size melts under proper scrutiny.
Hence why most systematic reviews do assess the quality of included studies and their risk of bias. Sometimes this is only used to give a mostly qualitative picture alongside the evidence synthesis (e.g. 'X% of our studies have a moderate to high risk of bias') or sometimes incorporated quantitatively (e.g. 'quality score' of studies included as a predictor/moderator, grouping by 'high/moderate/low' risk of bias, etc. - although all are controversial).
HLI's report does not assess the quality of its included studies, although it plans to do so. I appreciate GRADEing 90 studies or whatever is tedious and time consuming, but skipping this step to crack on with the quantitative synthesis is very unwise:[3] any such synthesis could be hugely distorted by low quality studies. And it's not like this is a mere possibility: I previously demonstrated in the previous meta-analysis that study registration status (one indicator of study quality) explained a lot of heterogeneity, and unregistered studies had on average a three times [!] greater effect size than registered ones.
The report notes it has done some things to help manage this risk. One is cutting 'outliers' (g > 2, the teal in the earlier histogram), and extensive assessment of publication bias/small study effects. These things do help: all else equal, I'd expect bigger studies to be methodologically better ones, so adjusting for small study effects does partially 'control' for study quality; I'd also expect larger effect sizes to arise from lower-quality work, so cutting them should notch up the average quality of the studies that remain.
But I do not think they help enough[4] - these are loose proxies for what we seek to understand. Thus the findings would be unreliable in virtue of this alone until after this is properly looked at. Crucially, the risk that these features could confound the earlier moderator analysis has not been addressed:[5] maybe the relationship of (e.g.) 'more sessions given -> greater effect' is actually due to studies of such interventions tend to be lower quality than the rest. When I looked last time things like 'study size' or 'registration status' explained a lot more of the heterogeneity than (e.g.) all of the intervention moderators combined. I suspect the same will be true this time too.
Publication bias
I originally suggested (6m ago?) that correction for publication bias/small study effects could be ~an integer division, so I am surprised the correction was a bit less: ~30%. Here's the funnel plot:[6]
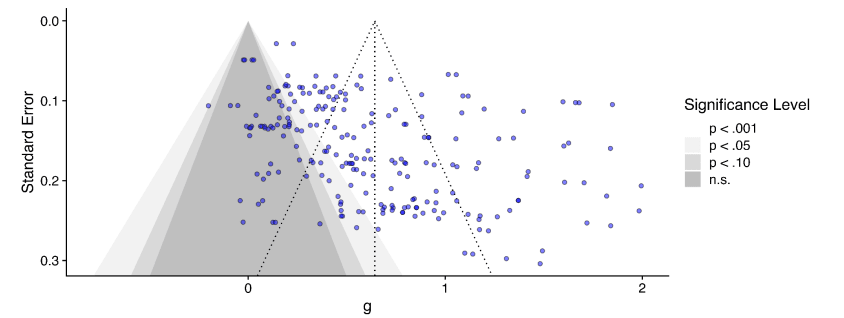
Unsurprisingly, huge amounts of scatter, but the asymmetry, although there, does not leap off the page: the envelope of points is pretty rectangular, but you can persuade yourself it's a bit of a parallelogram, and there's denser part of it which indeed has a trend going down and to the right (so smaller study -> bigger effect).
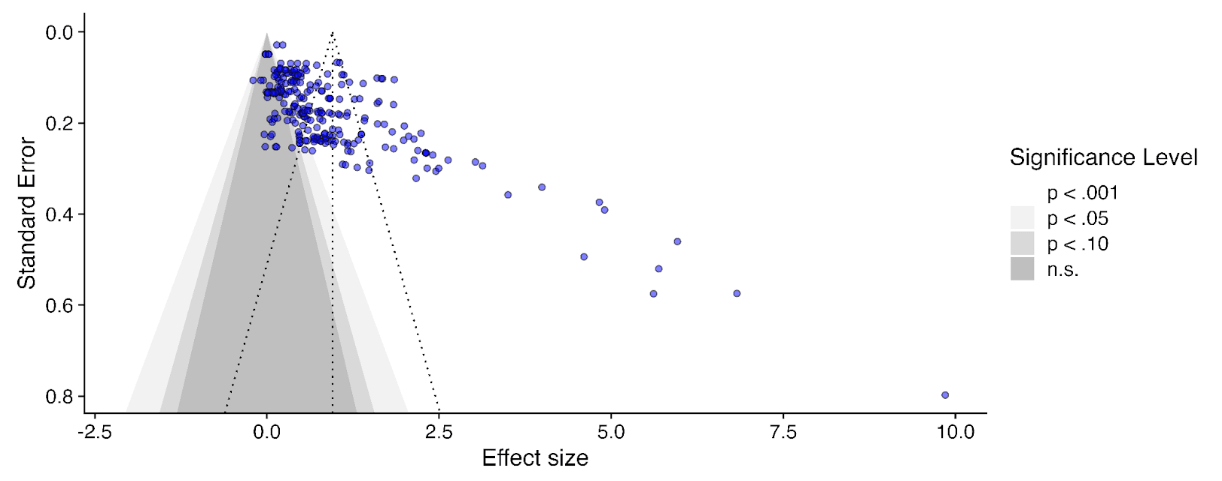
But this only plots effect sizes g < 2 (those red, not teal, in the histogram). If we include all the studies again, this picture looks a lot clearer - the 'long tail' of higher effects tends to come from smaller studies, which are clearly asymmetric.
This effect, visible to the naked eye, also emerges in the statistics. The report uses a variety of numerical methods to correct for publication bias (some very sophisticated). All of them adjust the results much further downwards on the full data than when outliers are excluded to varying degrees (table B1, appendix). It would have a stark effect on the results - here's the 'bottom line' result if you take a weighted average of all the different methods, with different approaches to outlier exclusion - red is the full data, green is the outlier exclusion method the report uses.
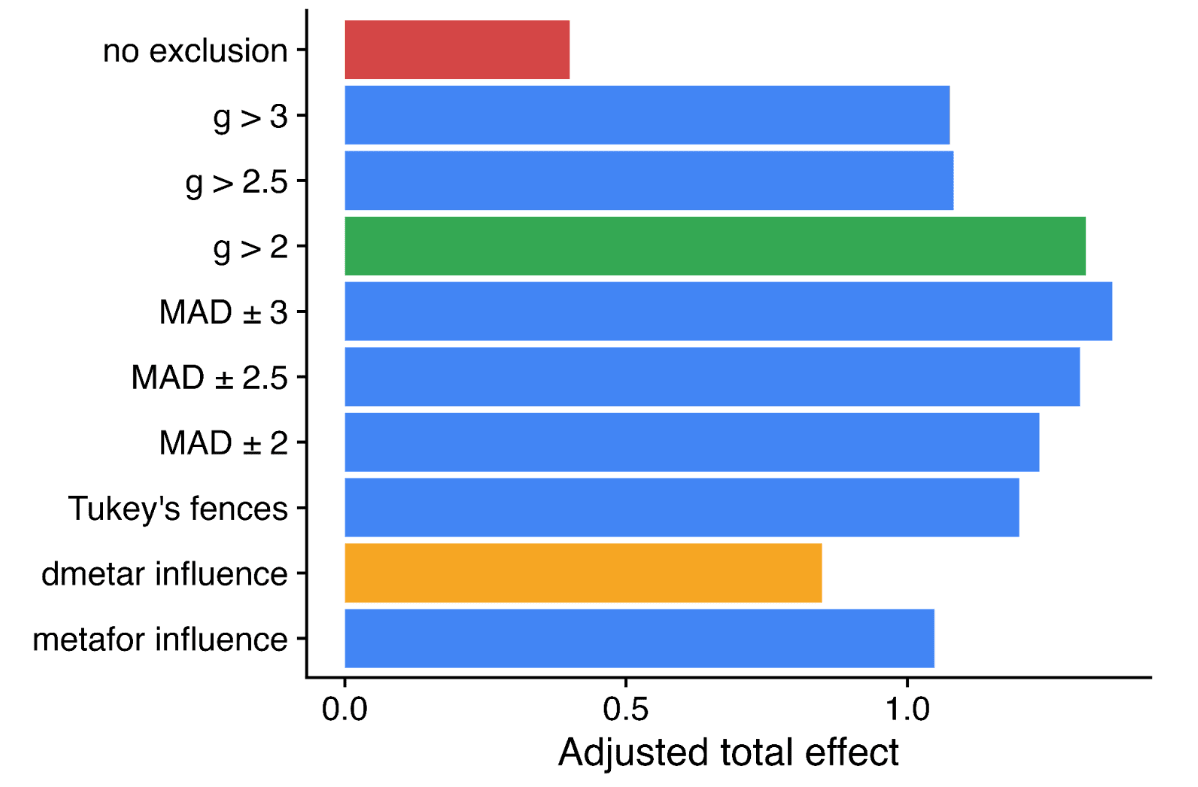
Needless to say, this choice is highly material to the bottom line results: without excluding data, SM drops from ~3.6x GD to ~1.1x GD. Yet it doesn't get a look in for the sensitivity analysis, where HLI's 'less favourable' outlier method involves taking an average of the other methods (discounting by ~10%), but not doing no outlier exclusion at all (discounting by ~70%).[7]
Perhaps this is fine if outlier inclusion would be clearly unreasonable. But it's not: cutting data is generally regarded as dubious, and the rationale for doing so here is not compelling. Briefly:
- Received opinion is typically that outlier exclusion should be avoided without a clear rationale why the 'outliers' arise from a clearly discrepant generating process. If it is to be done, the results of the full data should still be presented as the primary analysis (e.g.).
- The cut data by and large doesn't look visually 'outlying' to me. The histogram shows a pretty smooth albeit skewed distribution. Cutting off the tail of the distribution at various lengths appears ill-motivated.
- Given the interest in assessing small study effects, cutting out the largest effects (which also tend to be the smallest studies) should be expected to attenuate the small study effect (as indeed it does). Yet if our working hypothesis is these effects are large mainly because the studies are small, their datapoints are informative to plot this general trend (e.g. for slightly less small studies which have slightly less inflated results).[8]
The strongest argument given is that, in fact, some numerical methods to correct publication bias give absurd results if given the full data: i.e. one gives an adjusted effect size of -0.6, another -0.2. I could buy an adjustment that drives the effect down to roughly zero, but not one which suggests, despite almost all the data being fairly or very positive, we should conclude from these studies the real effect is actually (highly!) negative.
One could have a long argument on what the most appropriate response is: maybe just keep it, as the weighted average across methods is still sensible (albeit disappointing)? Maybe just drop those methods in particular and do an average of those giving sane answers on the full data? Should we keep g < 2 exclusion but drop p-curve analysis, as it (absurdly?) adjusts the effect slightly upwards? Maybe we should reweigh the averaging of different numerical methods by how volatile their results are when you start excluding data? Maybe pick the outlier exclusion threshold which results in the least disagreement between the different methods? Or maybe just abandon numerical correction, and just say "there's clear evidence of significant small study effects, which the current state of the art cannot reliably quantify and correct"?
So a garden of forking paths opens before us. All of these are varying degrees of 'arguable', and they do shift the bottom line substantially. One reason pre-specification is so valuable is it ties you to a particular path before getting to peek at the results, avoiding any risk a subconscious finger on the scale to push one down a path of still-defensible choices nonetheless favour a particular bottom line. Even if you didn't pre-specify, presenting your first cut as the primary analysis helps for nothing up my sleeve reasons.
It may be the prespecified or initial stab doesn't do a good job of expressing the data, and a different approach does better. Yet making it clear this subsequent analysis is post-hoc cautions a reader about potential risk of bias in analysis.
Happily, HLI did make a protocol for this work, made before they conducted the analysis. Unfortunately, it is silent on whether outlying data would be excluded, or by what criteria. Also unfortunately, because of this (and other things like the extensive discussion in the appendix discussing the value of outlier removal principally in virtue of its impact on publication bias correction), I am fairly sure the analysis with all data included was the first analysis conducted. Only after seeing the initial publication bias corrections did HLI look at the question of whether some data should be excluded. Maybe it should, but if it came second the initial analysis should be presented first (and definitely included in the sensitivity analysis).
There's also a risk the cloud of quantification buries the qualitative lede. Publication bias is known to be very hard to correct, and despite HLI compiling multiple numerical state of the art methods, they starkly disagree on what the correction factor should be (i.e. from <~0 to > 100%). So perhaps the right answer is we basically do not know how much to discount the apparent effects seen in the PT literature given it also appears to be an extremely compromised one, and if forced to give an overall number, any 'numerical bottom line' should have even wider error bars because of this.[9]
Bayesian methods
I previously complained that the guestimate/BOTEC-y approach HLI used in integrating information from the meta-analysis and the strongminds trial data couldn't be right, as it didn't pass various sanity tests: e.g. still recommending SM as highly effective even if you set the trial data to zero effect. HLI now has a much cleverer Bayesian approach to combining sources of information. On the bright side, this is mechanistically much clearer as well as much cleverer. On the downside, the deck still looks pretty stacked.
Starting at the bottom, here's how HLI's Bayesian method compares SM to GD:
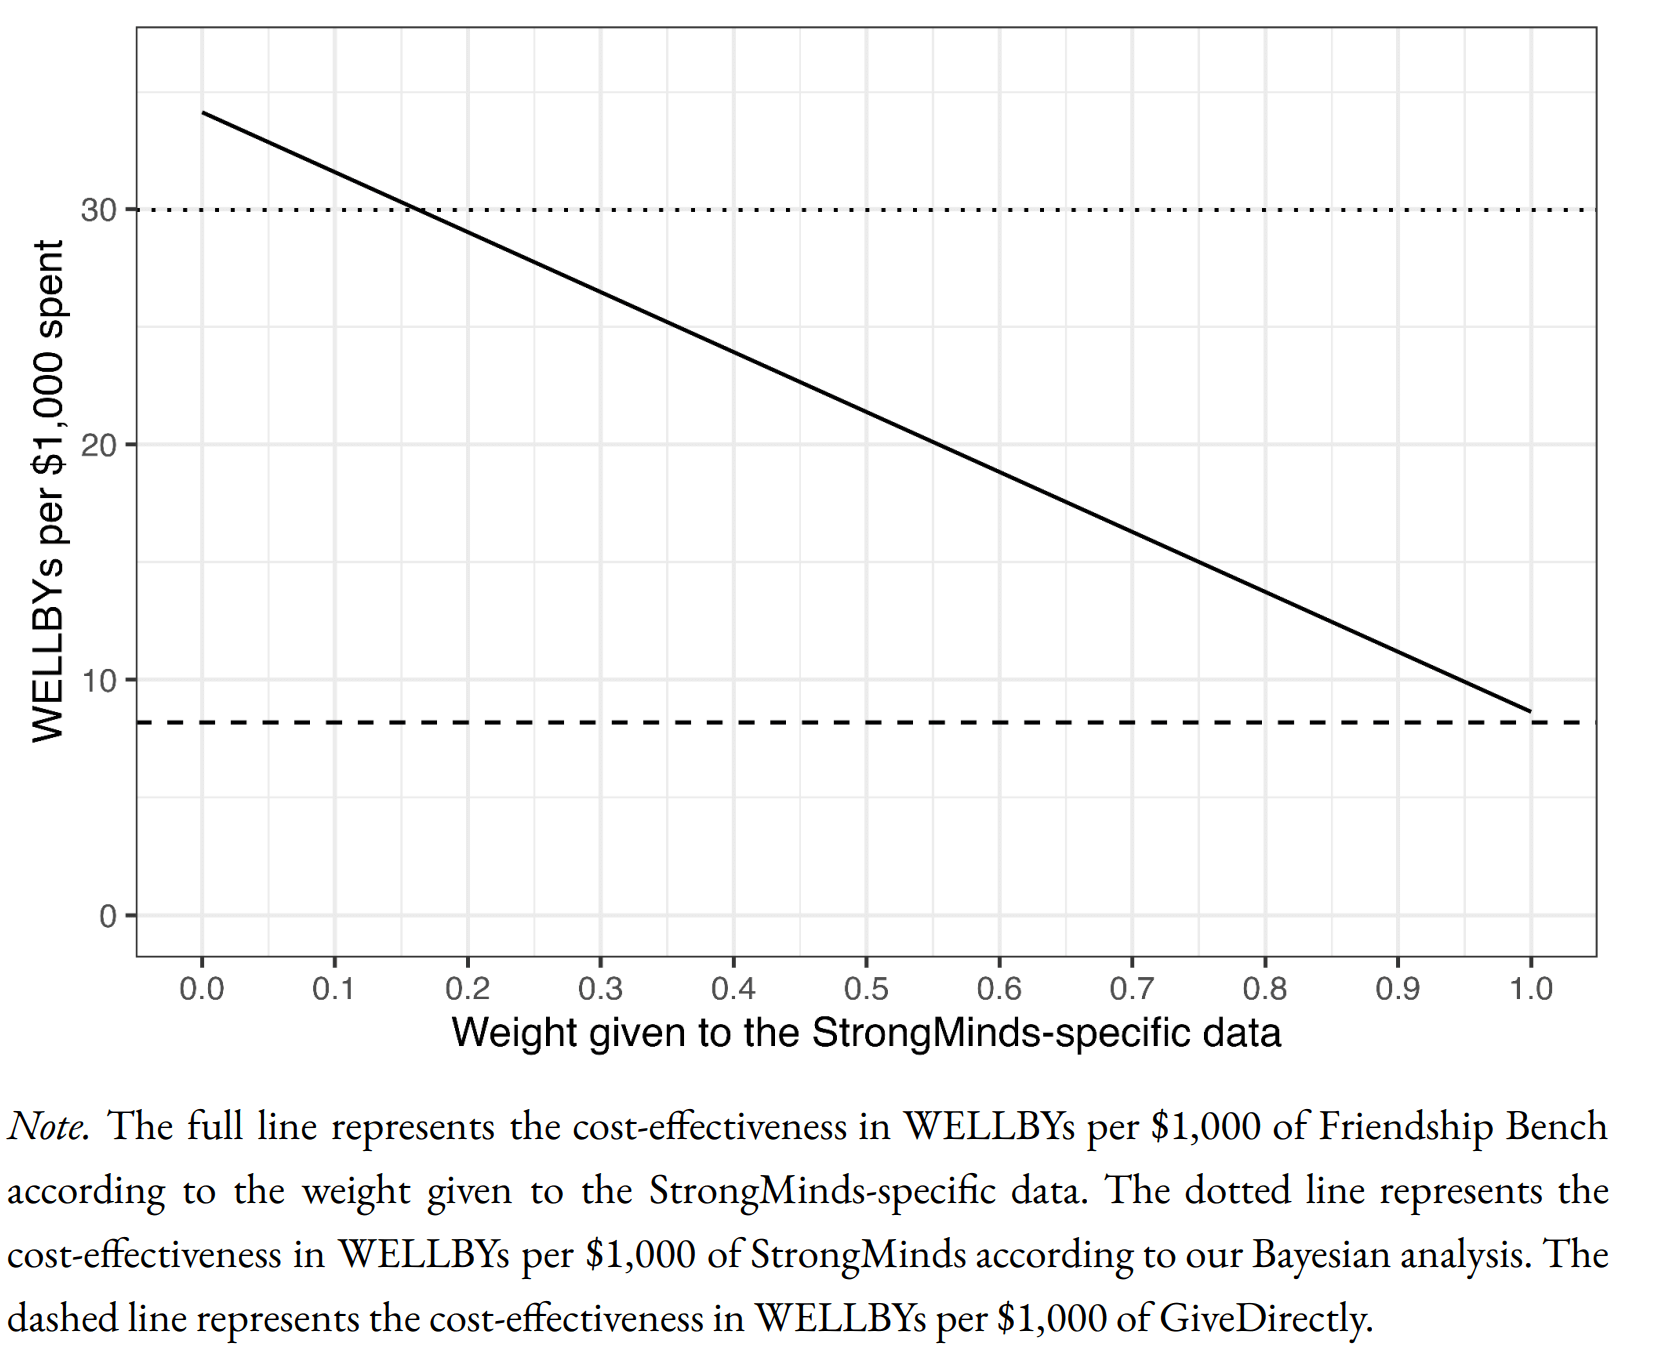
The informed prior (in essence) uses the meta-analysis findings with some monte carlo to get an expected effect for an intervention with strongminds-like traits (e.g. same number of sessions, same deliverer, etc.). The leftmost point of the solid line gives the expectation for the prior: so the prior is that SM is ~4x GDs cost effectiveness (dashed line).
The x axis is how much weight one gives to SM-specific data. Of interest, the line slopes down, so the data gives a negative update on SMs cost-effectiveness. This is because HLI - in anticipation of the Baird/Ozler RCT likely showing disappointing results - discounted the effect derived from the original SM-specific evidence by a factor of 20, so the likelihood is indeed much lower than the prior. Standard theory gives the appropriate weighting of this vs. the prior, so you adjust down a bit, but not a lot, from the prior (dotted line).
Despite impeccable methods, these results are facially crazy. To illustrate:
- The rightmost point on the solid line is the result if you completely discount the prior, and only use the stipulated-to-be-bad SM-specific results. SM is still slightly better than GD on this analysis.[10]
- If we 'follow Bayesian updating' as HLI recommends, the recommendation is surprisingly insensitive to the forthcoming Baird/Ozler RCT having disappointing findings. Eyeballing it, you'd need such a result to be replicated half a dozen times for the posterior to update to SM is roughly on a par with GD.
- Setting the forthcoming data to basically showing zero effect will still return SM is 2-3x GD.[11] I'd guess you'd need the forthcoming RCT to show astonishingly and absurdly negative results (e.g. SM treatment is worse for your wellbeing than bereavement), to get it to approximate equipoise with GD.
- You'd need even stronger adverse findings for the model to update all the way down to SM being ineffectual, rather than merely 'less good than GiveDirectly'.
I take it most readers would disagree with the model here too - e.g. if indeed the only RCT on strongminds is basically flat, that should be sufficient demote SM from putative 'top charity' status.
I think I can diagnose the underlying problem: Bayesian methods are very sensitive to the stipulated prior. In this case, the prior is likely too high, and definitely too narrow/overconfident. See this:
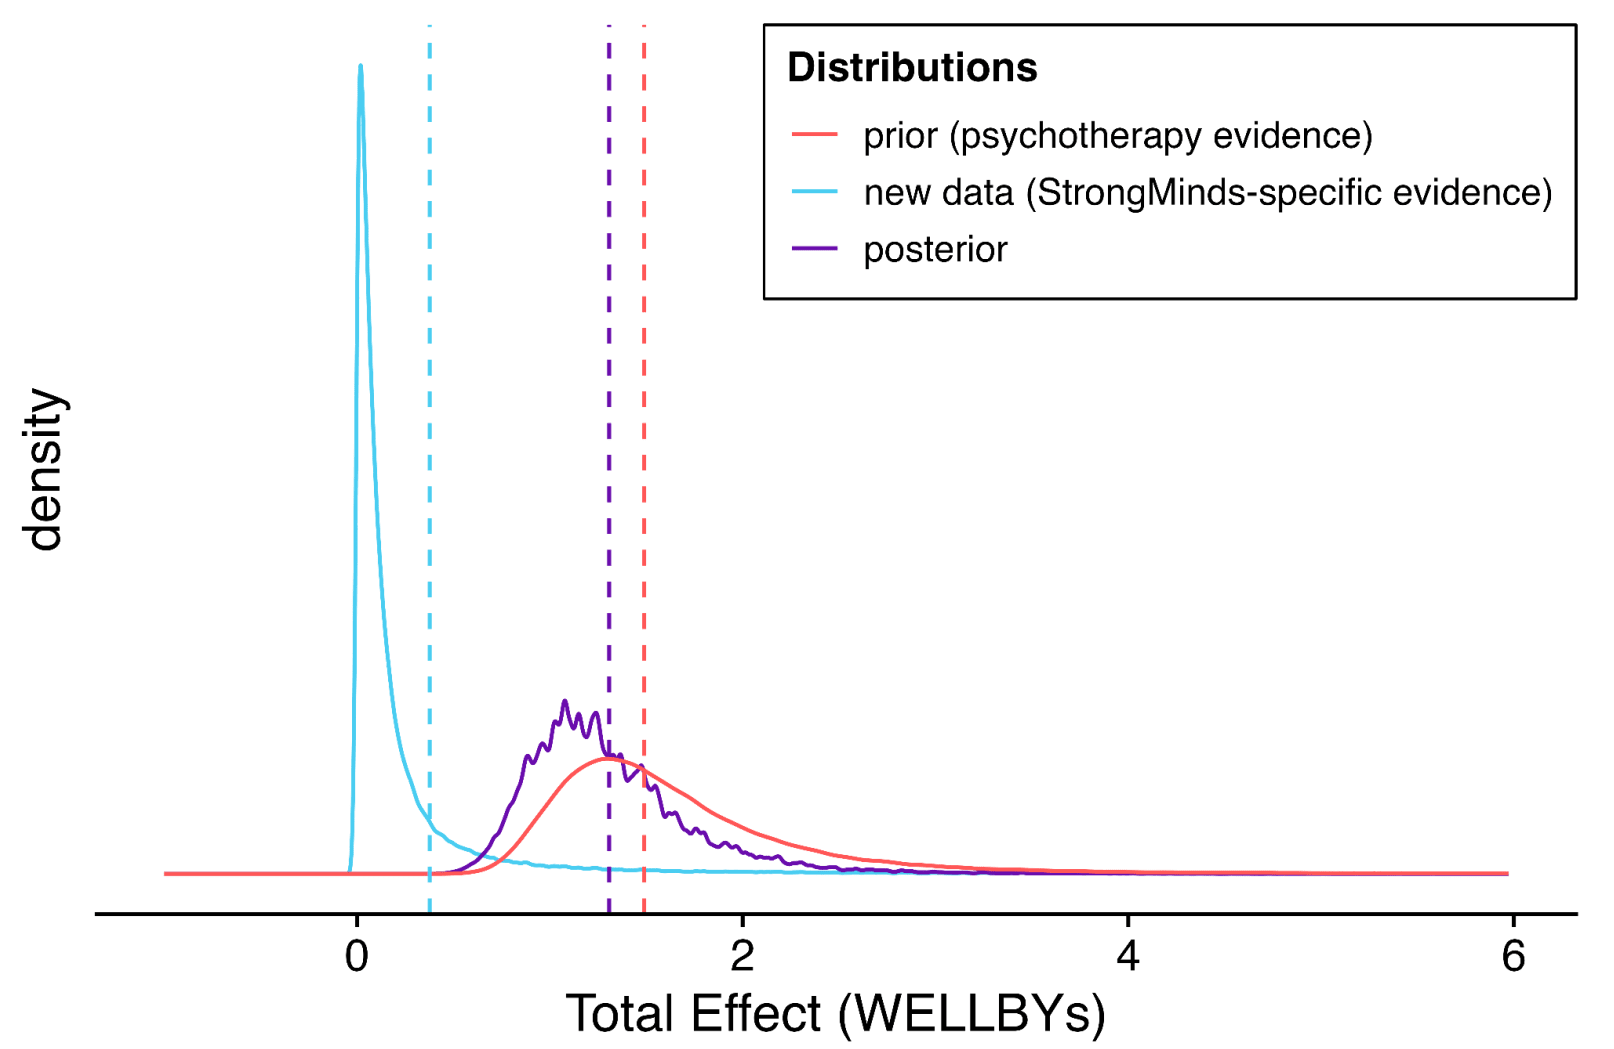
Per the dashed and dotted lines in the previous figure, the 'GiveDirectly bar' is fractionally below at the blue dashed line (the point estimate of the stipulated-SM data). The prior distribution is given in red. So the expectation (red dashed line) is indeed ~4x further from the origin (see above).
The solid red curve gives the distribution. Eyeballing the integrals reveals the problem: the integral of this distribution from the blue dashed line to infinity gives the models confidence psychotherapy interventions would be more cost-effective than GD. This is at least 99% of the area, if not 99.9% - 99.99%+. A fortiori, this prior asserts it is essentially certain the intervention is beneficial (total effect >0).
I don't think anyone should think that any intervention is P > 0.99 more cost-effective than give directly (or P < 0.0001 or whatever it is in fact harmful) as a prior,[12] but if one did, it would indeed take masses of evidence to change one's mind. Hence the very sluggish moves in response to adverse data (the purple line suggests the posterior is also 99%+ confident SM is better than givedirectly).
I think I can also explain the underlying problem of this underlying problem. HLI constructs its priors exclusively from its primary meta-analytic model (albeit adapted to match the intervention of interest, and recalculated excluding any studies done on this intervention to avoid double counting). Besides the extra uncertainty (so spread) likely implied by variety of factors covered in the sensitivity analysis, in real life our prior would be informed by other things too: the prospect entire literatures can be misguided, a general sense (at least for me) that cash transfers are easy to beat in principle, but much harder in practice, and so on.
In reality, our prior-to-seeing-the-metaanalysis prior would be very broad and probably reasonably pessimistic, and (even if I'm wrong about the shortcomings I suggest earlier), the 'update' on reading it would be a bit upwards, and a little narrower, but not by that much. In turn, the 'update' on seeing (e.g.) disappointing RCT results for a given PT intervention would be a larger shift downwards, netting out that this was unlikely better than GiveDirectly after all.
If the Bayesian update was meant only to be a neat illustration, I would have no complaint. But instead the bottom line recommendations and assessments rely upon it - that readers should indeed adopt the supposed prior the report proposes about the efficacy of PT interventions in general. Crisply, I doubt the typical reader seriously believes (e.g.) basically any psychotherapy intervention in LMICs, so long as cost per patient is <$100, is a ~certain bet to beat cash transfers. If not, they should question the report's recommendations too.
Summing up
Criticising is easier than doing better. But I think this is a case where a basic qualitative description tells the appropriate story, the sophisticated numerical methods are essentially a 'bridge too far' given the low quality of what they have to work with, and so confuse rather than clarify the matter. In essence:
- The literature on PT in LMICs is a complete mess. Insofar as more sense can be made from it, the most important factors appear to belong to the studies investigating it (e.g. their size) rather than qualities of the PT interventions themselves.
- Trying to correct the results of a compromised literature is known to be a nightmare. Here, the qualitative evidence for publication bias is compelling. But quantifying what particular value of 'a lot?' the correction should be is fraught: numerically, methods here disagree with one another dramatically, and prove highly sensitive to choices on data exclusion.
- Regardless of how PT looks in general, Strongminds, in particular, is looking less and less promising. Although initial studies looked good, they had various methodological weaknesses, and a forthcoming RCT with much higher methodological quality is expected to deliver disappointing results.
- The evidential trajectory here is all to common, and the outlook typically bleak. It is dubious StrongMinds is a good pick even among psychotherapy interventions (picking one at random which doesn't have a likely-bad-news RCT imminent seems a better bet). Although pricing different interventions is hard, it is even more dubious SM is close to the frontier of "very well evidenced" vs. "has very promising results" plotted out by things like AMF, GD, etc. HLI's choice to nonetheless recommend SM again this giving season is very surprising. I doubt it will weather hindsight well.
- ^
All of the figures are taken from the report and appendix. The transparency is praiseworthy, although it is a pity despite largely looking at the right things the report often mistakes the right conclusions to draw.
- ^
With all the well-worn caveats about measuring well-being.
- ^
The Cochrane handbook section on meta-analysis is very clear on this (but to make it clearer, I add emphasis)
10.1 Do not start here!
It can be tempting to jump prematurely into a statistical analysis when undertaking a systematic review. The production of a diamond at the bottom of a plot is an exciting moment for many authors, but results of meta-analyses can be very misleading if suitable attention has not been given to formulating the review question; specifying eligibility criteria; identifying and selecting studies; collecting appropriate data; considering risk of bias; planning intervention comparisons; and deciding what data would be meaningful to analyse. Review authors should consult the chapters that precede this one before a meta-analysis is undertaken.
- ^
As a WIP, the data and code for this report is not yet out, but in my previous statistical noodling on the last one both study size and registration status significantly moderated the effect downwards when included together, suggesting indeed the former isn't telling you everything re. study quality.
- ^
The report does mention later (S10.2) controlling a different analysis for study quality, when looking at the effect of sample size itself:
To test for scaling effects, we add sample size as a moderator into our meta-analysis and find that for every extra 1,000 participants in a study the effect size decreases (non-significantly) by -0.09 (95% CI: -0.206, 0.002) SDs. Naively, this suggests that deploying psychotherapy at scale means its effect will substantially decline. However, when we control for study characteristics and quality, the coefficient for sample size decreases by 45% to -0.055 SDs (95% CI: -0.18, 0.07) per 1,000 increase in sample size. This suggests to us that, beyond this finding being non-significant, the effect of scaling can be controlled away with quality variables, more of which that we haven’t considered might be included.
I don't think this analysis is included in the appendix or similar, but later text suggests the 'study quality' correction is a publication bias adjustment. This analysis is least fruitful when applied to study scale, as measures of publication bias are measures of study size: so finding the effects of study scale are attenuated when you control for a proxy of study scale is uninformative.
What would be informative is the impact measures of 'study scale' or publication bias have on the coefficients for the primary moderators. Maybe they too could end up 'controlled away with quality variables, more of which that we haven't considered might be included'?
- ^
There are likely better explanations of funnel plots etc. online, but my own attempt is here.
- ^
The report charts a much wiser course on a different "Outlier?" question: whether to include very long follow-up studies, where exclusion would cut the total effect in half. I also think including everything here is fine too, but the report's discussion in S4.2 clearly articulates the reason for concern, displays what impact inclusion vs. exclusion has, and carefully interrogates the outlying studies to see whether they have features (beyond that they report 'outlying' results) which warrants exclusion. They end up going 'half-and-half', but consider both full exclusion and inclusion in sensitivity analysis.
- ^
If you are using study size as an (improvised) measure of study quality, excluding the smallest studies because on an informal read they are particularly low quality makes little sense: this is the trend you are interested in.
- ^
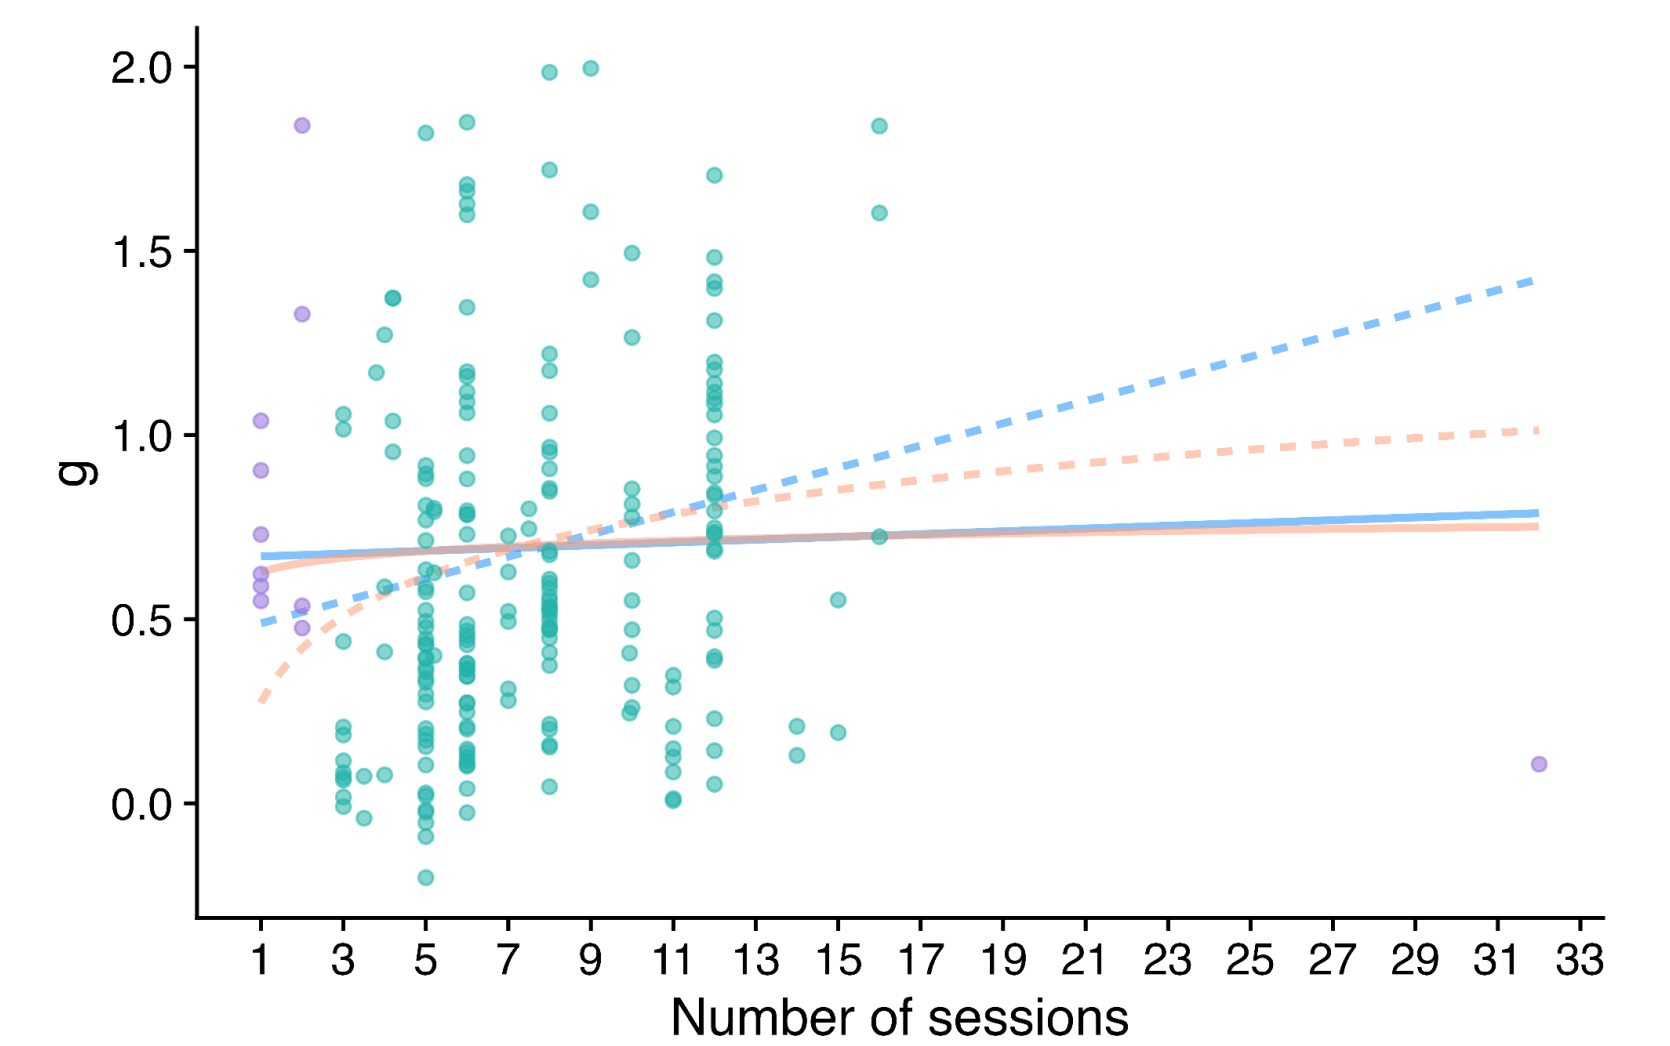
A similar type of problem crops up when one is looking at the effect of 'dosage' on PT efficacy.
The solid lines are the fit (blue linear, orange log) on the full data, whilst the dashed lines are fits with extreme values of dosage - small or large - excluded (purple). The report freely concedes its choices here are very theory led rather than data driven - and also worth saying getting more of a trend here makes a rod for SM and Friendship Bench's back, as these deliver smaller numbers of sessions than the average, so adjusting with the dashed lines and not the solid ones reduces the expected effect.
Yet the main message I would take from the scatter plot is the data indeed looks very flat, and there is no demonstrable dose-response relationship of PT. Qualitatively, this isn't great for face validity.
- ^
To its credit, the write-up does highlight this, but does not seem to appreciate the implications are crazy: any PT intervention, so long as it is cheap enough, should be thought better than GD, even if studies upon it show very low effect size (which would usually be reported as a negative result, as almost any study in this field would be underpowered to detect effects as low as are being stipulated):
Therefore, even if the StrongMinds-specific evidence finds a small total recipient effect (as we present here as a placeholder), and we relied solely on this evidence, then it would still result in a cost-effectiveness that is similar or greater than that of GiveDirectly because StrongMinds programme is very cheap to deliver.
- ^
The report describes this clearly itself, but seems to think this is a feature rather than a bug (my emphasis):
Now, one might argue that the results of the Baird et al. study could be lower than 0.4 WELLBYs. But – assuming the same weights are given to the prior and the charity-specific data as in our analysis - even if the Baird et al. results were 0.05 WELLBYs (extremely small), then the posterior would still be 1.49 * 0.84 + 0.05 * 0.16 = 1.26 WELLBYs; namely, very close to our current posterior (1.31 WELLBYs).
- ^
I'm not even sure that "P > 0.99 better than GD" would be warranted as posterior even for a Givewell recommended top charity, and I'd guess the GW staff who made the recommendation would often agree.
I agree - all else equal - you'd rather have a flatter distribution of donors for the diversification (various senses) benefits. I doubt this makes this an important objective all things considered.
The main factor on the other side of the scale is scale itself: a 'megadonor' can provide a lot of support. This seems to be well illustrated by your original examples (Utility Farm and Rethink). Rethink started later, but grew much 100x larger, and faster too. I'd be surprised if folks at UF would not prefer Rethink's current situation, trajectory - and fundraising headaches - to their own.
In essence, there should be some trade-off between 'aggregate $' and 'diversity of funding sources' (however cashed out) - pricing in (e.g.) financial risks/volatility for orgs, negative externalities on the wider ecosystem, etc. I think the trade between 'perfectly singular support' and 'ideal diversity of funding sources' would be much less than an integer factor, and more like 20% or so (i.e. maybe better getting a budget of 800k from a reasonably-sized group than 1M from a single donor, but not better than 2M from the same).
I appreciate the recommendation here is to complement existing practice with a cohort of medium sized donors, but the all things considered assessment is important to gauge the value of marginal (or not-so-marginal) moves in this direction. Getting (e.g.) 5000 new people giving 20k a year seems a huge lift to me. Even if that happens, OP still remains the dominant single donor (e.g. it gave roughly the amount this hypothetical cohort would to animal causes alone in 2022). A diffuse 'ecosystem wide' benefits of these additional funders struggles by my lights to vindicate the effort (and opportunity costs) of such a push.
An update:
This RCT (which should have been the Baird RCT - my apologies for mistakenly substituting Sarah Baird with her colleague Berk Ozler as first author previously) is now out.
I was not specific on which effect size would count, but all relevant[1] effect sizes reported by this study are much lower than d = 0.4 - around d = 0.1. I roughly[2] calculate the figures below.
In terms of "SD-years of depression averted" or similar, there are a few different ways you could slice it (e.g. which outcome you use, whether you linearly interpolate, do you extend the effects out to 5 years, etc). But when I play with the numbers I get results around 0.1-0.25 SD-years of depression averted per person (as a sense check, this lines up with an initial effect of ~0.1, which seems to last between 1-2 years).
These are indeed "dramatically worse results than HLI's [2021] evaluation would predict". They are also substantially worse than HLI's (much lower) updated 2023 estimates of Strongminds. The immediate effects of 0.07-0.16 are ~>5x lower than HLI's (2021) estimate of an immediate effect of 0.8; they are 2-4x lower than HLI's (2023) informed prior for Strongminds having an immediate effect of 0.39. My calculations of the total effect over time from Baird et al. of 0.1-0.25 SD-years of depression averted are ~10x lower than HLI's 2021 estimate of 1.92 SD-years averted, and ~3x lower than their most recent estimate of ~0.6.
Baird et al. also comment on the cost-effectiveness of the intervention in their discussion (p18):
I'm not sure anything more really needs to be said at this point. But much more could be, and I fear I'll feel obliged to return to these topics before long regardless.
The report describes the outcomes on p.10:
Measurements were taken following treatment completion ('Rapid resurvey'), then at 12m and 24m thereafer (midline and endline respectively).
I use both primary indicators and the discrete values of the underlying scores they are derived from. I haven't carefully looked at the other secondary outcomes nor the human capital variables, but besides being less relevant, I do not think these showed much greater effects.
I.e. I took the figures from Table 6 (comparing IPT-G vs. control) for these measures and plugged them into a webtool for Cohen's h or d as appropriate. This is rough and ready, although my calculations agree with the effect sizes either mentioned or described in text. They also pass an 'eye test' of comparing them to the cmfs of the scores in figure 3 - these distributions are very close to one another, consistent with small-to-no effect (one surprising result of this study is IPT-G + cash lead to worse outcomes than either control or IPT-G alone):
One of the virtues of this study is it includes a reproducibility package, so I'd be happy to produce a more rigorous calculation directly from the provided data if folks remain uncertain.