I got this idea after I read a few of CE (Charity Entrepreneurship) cost-effectiveness estimates when I was preparing my application for the CE research training program. Although this is not a major pressing improvement, this definitely is an iterative improvement over the current methodology and I haven’t seen anyone else raising this point yet.
CE uses DALYs averted as a measure of impact:
- DALYs (Disability-Adjusted Life Years): A measure of disease burden, expressed in years lost to disability or early death. Dying one year before your expected life span causes 1 DALY. DALYs are averted when we save someone from dying early, or when we reduce the number of sick people or the duration of their sickness. DALYs for a disease are the sum of YLLs and YLDs: .
- Years of Life Lost (YLLs): Calculated as the difference between the age at death and the life expectancy. Death is the worst possible outcome, and it gets one DALY per person per year.
- Years Lived with Disability (YLDs): Calculated by multiplying the severity of an illness or disability by its duration.
- DALYs averted: I like to think of DALYs averted as the difference between DALYs without intervention and DALYs with intervention. This captures the notion of counterfactuality, meaning our estimate should reflect the difference between a world where the intervention happened and one where it didn't.
For example, if an intervention saves a person who would have otherwise died at 30 and the life expectancy is 70, 40 YLLs are averted (without considering temporal discounting and age-weighing). If the intervention reduces a year of severe disability (with a disability weight of 0.5), 0.5 YLDs are averted.
When Charity Entrepreneurship estimates the number of DALYs that an intervention would avert, it uses a pre-made table by GiveWell. This table includes age weighting (which gives years in around 20-30 more value) and applies temporal discounting at 4% per year. CE uses the average values (last column).
Table 1: GiveWell estimates of value of life saved at various ages of death. The table is available here and made using a formula that you can find here.
| Age of death | Life expectancy (years) | YLL incorporating discount and age-weighting | |||
| Females | Males | Females | Males | Average | |
| 0 | 82.5 | 80 | 33.13 | 33.01 | 33.07 |
| 5 | 77.95 | 75.38 | 36.59 | 36.46 | 36.53 |
| 15 | 68.02 | 65.41 | 36.99 | 36.80 | 36.90 |
| 30 | 53.27 | 50.51 | 29.92 | 29.62 | 29.77 |
| 45 | 38.72 | 35.77 | 20.66 | 20.17 | 20.41 |
| 60 | 24.83 | 21.81 | 12.22 | 11.48 | 11.85 |
| 70 | 16.2 | 13.58 | 7.48 | 6.69 | 7.09 |
| 80 | 8.9 | 7.45 | 3.76 | 3.27 | 3.52 |
| 90 | 4.25 | 3.54 | 1.53 | 1.30 | 1.42 |
| 100 | 2 | 1.46 | 0.57 | 0.42 | 0.50 |
CE takes the exact values from the table. When an intervention saves someone who is 30 years old they literally take the value 29.77 DALYs which only includes temporal discounting and age-weighing.
This implicitly assumes that the subject would live a perfectly healthy life to the life expectancy used in the estimation. The full value of e.g. 29.77 DALYs averted was calculated assuming the subject lives healthy to the life expectancy. He is not going to — The subject is almost definitely going to get sick and will fail to realize the full value.
Why This Matters
We want our cost-effectiveness analyses (CEAs) to measure counterfactual impact. The difference between the world where the intervention happened and the one where it didn't should be the key result. If we take the full value of the life saved, we will overestimate the value by the DALYs the subject will incur while being sick. This is crucial when choosing between interventions that improve lives compared to interventions that save lives.
Is CE really making this mistake?
I’m pretty sure they do. Here, I try to show the exact place where it happens.
Typically, a CEA by CE will feature “standard inputs” sheet with this table:
Table 2: Standard inputs table included in a typical CEA made by CE.
| Age of death | DALYs (weighted) |
| 0 | 33.07 |
| 5 | 36.53 |
| 15 | 36.9 |
| 30 | 29.77 |
| 45 | 20.41 |
| 60 | 11.85 |
| 70 | 7.09 |
As you can see, this is a shortened version of the table 1 above. This table is later used when estimate the total impact.
Childhood vaccination reminders and encouragement (report) (CEA)
I’m not going to include the exact formula for impact here — I think it would make my point less understandable. The core argument is based on the fact that those exact values from the table are used and are usually only later discounted by 4% yearly, which does not offset for the suffering the subjects will experience by living a typical life. Open the sheet (same link as link to CEA above) and take a look and follow my reasoning:
The final formula for the DALYs averted is:
=NPV($C$125,163:163) + NPV($C$125, 170:170)
It comes from the cell C175. This is the sum of:
- DALYs equivalent of cost incurred by the beneficiaries discounted by 4% every year
- DALYs coming from deaths averted, discounted by 4% every year
Those values come from this table:
Table 3:
| Benefits – impact numbers (deaths averted) | |
| Deaths averted <1 yr | 51.06 |
| Deaths averted 1-4 yr | 144.17 |
| Deaths averted 5-14 yr | 1.55 |
| Deaths averted 15-49 yr | 3.48 |
| Deaths averted 50-74 yr | 9.34 |
| Total | 209.60 |
| Benefits – impact numbers (DALY averted) | |
| DALYs averted <1 yr | 1,688.53 |
| Deaths averted 1-4 yr | 5,266.46 |
| Deaths averted 5-14 yr | 57.06 |
| Deaths averted 15-49 yr | 70.98 |
| Deaths averted 50-74 yr | 66.25 |
| Total | 7,149.28 |
| Costs (disbenefits) to beneficiaries | |
| Income doublings | -110.5 |
| DALY equivalents | -48.0 |
| DALY equivalents (assume 5% less uptake per year) | -48.0 |
It represents the impact of the organization in one year. The deaths averted are translated to DALYs using formula:
Number of deaths averted × Value of averting death at that point in DALYs
The value of averting death comes from the standard inputs table mentioned eariler.
Behavioral interventions to support snakebite prevention and control (report) (CEA)
Snakebites CEA explicitly assumes that the value of life saved is 30 DALYs for someone who would otherwise die at the age of 30.
Table 4: Key Assumptions in Behavioral interventions to support snakebite prevention and control
| Key assumptions | ||||
| Discount rate | % | 4.0% | ||
| Probability of success | % | 66% | ||
| DALYs averted per snakebite (Health + Economic) | DALY | 5 | See Health and financial burden tab. | |
| DALYs averted per death averted | DALY | 30 | Median age of death is 30 | https://www.thelancet.com/action/showPdf?pii=S2214-109X%2822%2900028-6 |
Can we fix this?
Yes, we can fix this fairly easily. We should decrease the number of DALYs gained from interventions (or components of interventions) that saves lives by roughly 10%.
To get that number I used data from Global Burden of Disease Study to get a rough number of YLDs that one will suffer when living in World Bank income regions:
Figure 1: age-standardized rates of YLDs per World Bank income regions since 1990 to 2020.
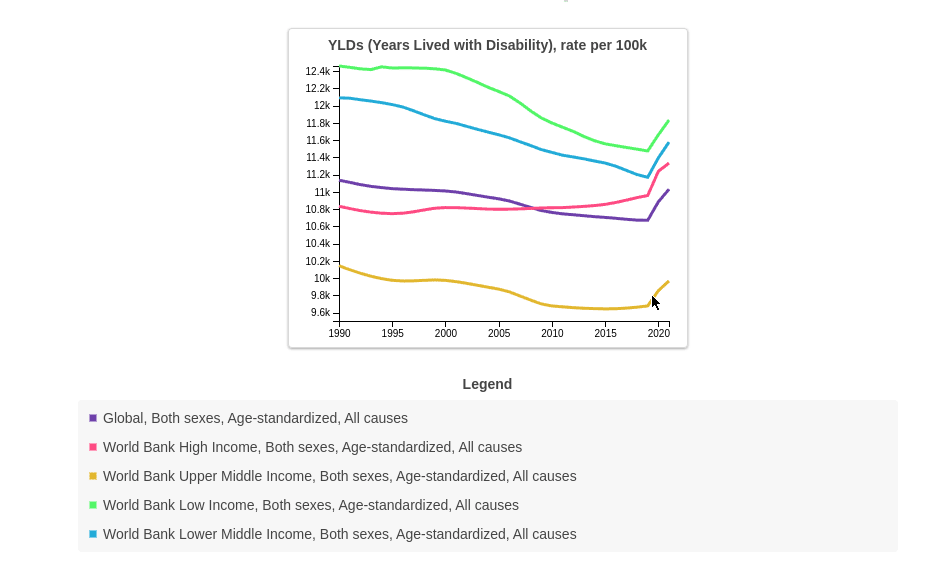
Here is a table of YLDs one would suffer on average living in those regions in 2021 (basically the rates above but divided by 100 000):
Table 5: Average number of YLDs one would suffer per year living in a given WHO income region.
| WHO income region | YLDs |
| Global | 0.11 |
| High-middle SDI | 0.09 |
| High SDI | 0.11 |
| Low-middle SDI | 0.11 |
| Middle SDI | 0.10 |
| Low SDI | 0.12 |
The formula for the number is the table above is:
For more accurate calculations of YLDs, we could categorize individuals by age groups and determine the average YLDs for specific age groups. However, the online data visualization tool provided by the Global Burden of Disease study only gives age-standardized YLDs for all ages.
The graph above shows that the variance in the rates isn’t high—they are limited between 12.4k and 9.6k since 1990. This consistency is a good sign that we can use these estimates for future projections. Besides that, the values closer in the future matter more for the adjustment since they aren’t discounted yet.
I think this is an improvement over current CE methodology, but I’m still unsure about some of my thoughts:
- I don’t know if the methodology changed since 1990 and how consistent those numbers are.
- I’m also not sure if the YLDs are comparable between countries. I expect that an YLD in a High SDI might be worth less than a YLD in Low SDI.
- This can be a major mistake for interventions that save a life but leave the person with some extra disability.
Update after getting feedback from CE:
After sending this post for a review to CE I did some further research based on their questions and things CE was not sure about:
Is this built into the formula for the value of saving a life somehow?
The formula for the value of saving a life at a specific age that is used to create the standard inputs table is quite complicated:
Figure 2:
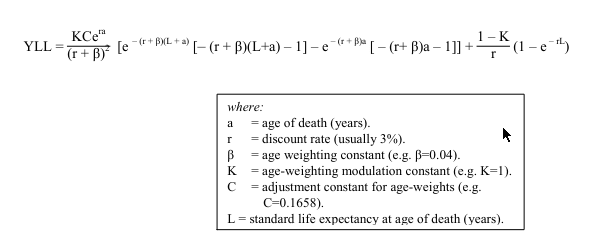
Where does it come from? From this document. I will try to explain it: intuitively, Given age of death a and life expectancy L the value of saving a life is:
which translates to:
I tried to integrate the above formula (just to check if the both come out to the same) but I failed so I recreated it using numerical approximation in Python to confirm that there isn’t any kind of discount factor going into there besides age-weighing and temporal discounting, and I compared the results from my function to the results from the ‘standard inputs’ sheet. They are the same. The complex function above only include age-weighing and temporal discounting.
Can discount rate account for that?
The discount rate reduces the benefits later in time by an increasing factor. The adjustment I’m suggesting should probably remain constant or diminish over time to account for improving healthcare, which decreases the YLDs people suffer. Crucially, we start with the full value of 10% immediately. The discount rate decreases the gains further in the future, which contrasts with my suggested improvement.
Can age-weighing account for that?
The reduction of DALYs I’m writing about, should reduce the total value of saving a life while age-weighting shits it around. They function differently. Additionally, I checked how age weighting without discounting, given the B and C parameters used by GiveWell, changes the value of saving lives:
Figure 3: DALYs averted by saving a life of 20 year old and 0 year old give life expectancy = x
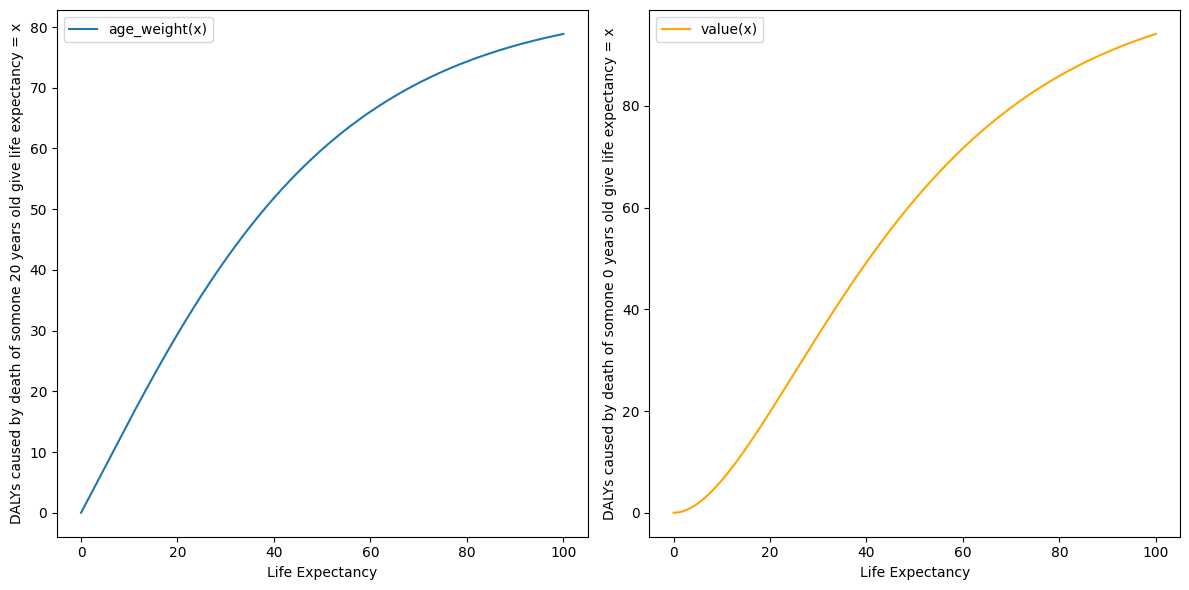
It turns out, if not discounting, you would actually get more DALYs by saving an 0 year old who would othwerwise live 60 years you can get almost 70 DALYs!
Other random ideas that might be even more important than the main point
Is GiveWell also making this mistake?
They don’t. I briefly read GiveWell 2024 CEA, GiveWell's CEA of insecticide-treated net, GiveWell's 2020 moral weights and GiveWell doesn’t try to estimate DALYs averted in their estimates but instead of that decided to use “units of value”:
Deaths averted at different ages
We combined the donor preferences with years of life lost (YLLs) and with past staff weights, using years of life lost as a proxy for the IDinsight survey (because they look broadly similar, but the IDinsight survey results are too jagged to use wholesale) and using James Snowden's 2018 moral weights as a proxy for GiveWell staff (because his weights were near the median and he had provided a complete set of age groups).
We weighted these sources as follows:
- 60% weight on donor responses
- 10% weight on James Snowden's 2018 weights (as a proxy for 2018 GiveWell staff)
- 30% weight on YLLs (both as a commonly-used metric itself and as a proxy for the IDinsight survey)
Donor responses received the majority of the weight primarily because in our view, that curve represents the most plausible set of weights. In particular, the other two do not distinguish between early neonatal deaths and deaths at age one, which is an age range we're especially interested in.
We use donor weights as our result for stillbirths because we don't have data from the other sources on stillbirths.
GiveWell assessment is more nuanced but also less grouned in "real" DALYs which makes it harder to say if it includes the adjustment I'm suggesting. It might be that the weights coming from donors already adjust for that.
Hi there. I am Research Director at CE/AIM
Note that Charity Entrepreneurship (CE) has now rebranded to AIM to reflect our widening scope of programs
[Edited for tone]
Thank you so much for engaging with our work in this level of detail. It is great to get critical feedback and analysis like this. I have made a note of this point on my long list of things to improve about how we do our CEAs, although for the reasons I explain below it is fairly low down on that list.
Ultimately what we are using now is a very crude approximation. That said it is one I am extremely loath to start fiddling without putting the effort in to do this well.
You are right that the numbers used for comparing deaths and disability are a fairly crude approximation. A reasonable change in moral weights can lead to a large change in the comparison between YLDs and YLLs. Consider that when GiveWell last reviewed their moral weights (between 2019 and 2020) they increased the value of an under-5 life saved compared to YLDs by +68% (from 100/3.3 to 116.9/2.3). Another very valid criticism is that (as you point out) the current numbers we are using are calculated with a 3% discount rate, yet we are now using a 1.5% discount rate for health effects, so perhaps to ensure consistency we should increase the numbers by +42%ish. Or taking the HLI work on the value of death seriously could suggest a huge decrease of -50% or more. The change you suggest would be nice but I think getting this right really needs a lot of work.
Right now I am uncertain how best to update these numbers. A minus -10% change is reasonable but so are many other changes. I would very much like AIM to have our own calculated moral weightings that account for various factors, including life expectancy, a range of ethical views, quality of life, beneficiary preferences, etc. However getting this correct is a complicated and lengthy process. This is on the to-do list but has not happened yet unfortunately.
So what do we do in the meantime:
Ultimately I believe that this is sufficient for the level of decision making we need to make.
I hope that someday soon we have the time to work this out in detail.
ACTIONS.
• [Edited: I wont change anything straight away as the model as a bunch of modelling in this research round has already been done, and for now I would rather use numbers I can back up with a source than numbers that are tweaked for one reason but not another reason.]
• I have added a note about the point you raise to our internal list of ways to improve our CEAs. [Edit: I really would like to make some changes here going forward. I expect that if I put a few hours into this the number is more likely to go up than down given the discount rate difference (and the staff survey).]
• I might also do some extra sensitivity analysis on our CEAs to highlight the uncertainty around this factor and ensure it is flagged to decision makers.
So thank you for raising this.
I don't buy your line of argument that just because what you do "crude approximation" or "scratching the surface" (which I agree with and many commentators have pointed out) is a reason not to include new variables to your model. That seems like conflating two issues. Obviously assumptions and errors are massive, but that's not a reason not to continuously be improving models.
Like @Larks says its not about a constant 10% reduction, but taking something extra into account which makes sense could meaningfully be added to the model.
Just because it might not be the most important thing right now or "low down your list" isn't a reason from my perspective not to include it.
I agree that you are probably underestimating rather than overstimating in general, and I actually prefer AIM/CEs approach to GiveWell's partly for the reason that this post exists - it is a bit easier to scrutinise and criticise, and therefore potentially easier to improve.
As a side note your response (probably unintentionally) feels just a little unnecesarily defensive but I might be reading too much into it.
Hi Nick, Thank you very much for the comment. These are all good points.
I fully agree with you and Larks that where a specific intervention will have reduced impact due to long run health effects this should be included in our models and I will check this is happening.
I apologise for the defensiveness and made a few minor edits to the post trying to keep content the same.
To be clear, we are always always improving our CEA models. This is an ongoing iterative process, and my hope is they get better year upon year. However, I guess I don't have confidence right now that a -10% change to this number is actually improving the model or affecting our decision making.
If we dive into these numbers just a bit, I immediately notice that the discount rate in the GBD data is higher than ours and that should suggest that, if we are adjusting these numbers, that probably we want a significant +increase not decrease. But that then raises the question of what discount rate we are using and why, which has a huge effect on some of the models – and this is something there are currently internal debates in the team about, and we are looking at changing. But this then raises a question about how to represent the uncertainty about these numbers in our models and ensure the decision makers and readers are more aware of the inherent estimations that can have big effect on CEA outputs – and improving this is probably towards the top of my list.
I just want to flag that I've raised the issue of the inconsistencies in the use of discount rate (if by "the discount rate in the GBD data" you mean the 3% or 4% discount rate in the standard inputs table) in an email sent a few days ago to one of the CE employees. Unfortunately, we failed to have a productive discussion, as the conversation died quickly when CE stopped responding. Here is one of the emails I sent:
Nice one I love that response.
Makes sense that you aren't confident about this particular change yet, are discussing improvement with the team and that you are concerned about the overall situation that on balance you think your numbers are too low and you probably want a increase rather than a decrease.
To reiterate I love that you have a model which can actually be scrutinised and meaningfully iterated - I still can't really get my head around GiveWell's but maybe I haven't tried hard enough.
No matter what system is used error's are going to be massive, so why not make it more understandable and editable?
I think the issue isn't so much a constant -10%, but that some specific life-saving interventions might saves lives yet leave people with unusually low quality of life, and for those interventions the error term might be much larger than 10%.
Thank you Larks. This is a very good point and I fully agree.
In any cases where this happens it should be incorporated into our current model. That said I will check this for our current research and make sure that in any such cases (such as say pulmonary rehabilitation for COPD where patients are expected to have a lower quality of life if they survive) this is accounted for.
I might have been too directive when writing this post. I lack the organizational context and knowledge of how CEAs are used to say definitively that this should be changed. I ultimately agree that this is a small change that might not affect the decisions made, and it's up to you to decide whether to account for it. However, some of the points you raised against updating this are incorrect.
I might have focused too much on the 10% reduction, while the real issue, as Elliot mentioned, is that you ignore two variables in the formula for DALYs averted:
Missing out on three 10% reductions in error X results in a difference of 0.1^3 = 27.1% which could be significant. I generally view organizations as growing through small iterative changes and optimization rather than big leaps.
My critique is only valid if you are trying to measure DALYs averted. If you choose to do something similar to GiveWell, which is more arbitrary, then it might not make sense to adjust for this anymore.
The three changes to the value of life saved come from different frameworks:
EDIT:
I can't say much about the GiveWell 1.5% rate, but I've heard it comes from the Rethink Priorities review, but it suggests 4.3% discount rate: can you direct me somewhere where I can read more about it?
Hi, Thank you. All good points. Fully agree with ongoing iterative improvement to our CEAs and hopefully you will see such improvements happening over the various research rounds (see also my reply to Nick). I also agree with picking up on specific cases where this might be a bigger issue (see my reply to Larks). I don’t think it is fair to say that we treat those two numbers as zero but it is fair to say we are currently using a fairly crude approximation to get at what those numbers are getting it in our lives saved calculations.
For a source on discounting see here: https://rethinkpriorities.org/publications/a-review-of-givewells-discount-rate#we-recommend-that-givewell-continue-discounting-health-at-a-lower-rate-than-consumption-but-we-are-uncertain-about-the-precise-discount-rate
"Discounting consumption vs. health benefits | Discount health benefits using only the temporal uncertainty component"
I upvoted this because I like questions like this being asked, and people doing work to really dig in to what a model is doing.
That said, I don't feel very concerned about this issue.
(Low Confidence, this is a new area for me).
DALYs averted = Without Intervention (Years of life lost + Years Lived With Disability) - After intervention (Years of life lost + Years Lived With Disability)
Years Lived With Disability (YLD) = Disability Weight * Duration .
If the duration of the disability is the entire lifespan of somebody, then it becomes quite a significant factor.
Upvoted :)
I agree with Ben Millwood's comment that I don't think this would change many decisions in practice.
To add another point, input parameter uncertainty is larger than you probably think, even for direct-delivery GHD charities (let alone policy or meta orgs). The post Quantifying Uncertainty in GiveWell Cost-Effectiveness Analyses visualises this point particularly vividly; you can see how a 10% change doesn't really change prioritisation much:
(Look at how large those 95% CIs are vs a 10% change.)
I think a useful way to go about this is to ask, what would have to change to alter the decisions (e.g. top-recommended charities, intervention ideas turned into incubated charities, etc)? This gets you into uncertainty analysis, to which I'd point you to froolow's Methods for improving uncertainty analysis in EA cost-effectiveness models.
I agree, this wouldn't change much probably, but this is a change that applies to a lot of CEAs and is in some way a straightforward and safe change?
@Mo Putera love the graph! Why is something being a small change a reason not to include it?
Disclosure: I discussed this with OP (Mikołaj) previous to it being posted.
Low confidence in what I am saying being correct, I am brand new to this area and trying to get my head around it.
I agree this is not a bad way to fix post-hoc. One concern I would have using this model going forward, is that you may overweight interventions that leave the beneficiary with some sort of long lasting disability.
Take the example of administering snakebite anti-venom, if we assumed that 1/2 of beneficiaries that counterfactually survive are likely to have lost a limb, if you don't account for that in your DALY's averted, then snakebite anti-venom's DALYs averted will be artificially inflated compared to an interventions who's counterfactual beneficiaries don't have high levels of Years Lived with Disability.
Executive summary: Charity Entrepreneurship's cost-effectiveness analyses overestimate the value of saving lives by not accounting for the years lived with disability that saved individuals will experience, which could be corrected by reducing the estimated DALYs averted from life-saving interventions by roughly 10%.
Key points:
This comment was auto-generated by the EA Forum Team. Feel free to point out issues with this summary by replying to the comment, and contact us if you have feedback.
Thanks for the analysis, Mikolaj. I would be curious to know your thoughts on my estimate that corporate campaigns for chicken welfare are 1.51 k times as cost-effective as GiveWell's top charities.