I currently work with CE/AIM-incubated charity ARMoR on research distillation, quantitative modelling and general org-boosting to support policy advocacy for market-shaping tools to incentivise innovation and ensure access to antibiotics to help combat AMR.
I previously did AIM's Research Training Program, was supported by a FTX Future Fund regrant and later Open Philanthropy's affected grantees program, and before that I spent 6 years doing data analytics, business intelligence and knowledge + project management in various industries (airlines, e-commerce) and departments (commercial, marketing), after majoring in physics at UCLA and changing my mind about becoming a physicist. I've also initiated some local priorities research efforts, e.g. a charity evaluation initiative with the moonshot aim of reorienting my home country Malaysia's giving landscape towards effectiveness, albeit with mixed results.
I first learned about effective altruism circa 2014 via A Modest Proposal, Scott Alexander's polemic on using dead children as units of currency to force readers to grapple with the opportunity costs of subpar resource allocation under triage. I have never stopped thinking about it since, although my relationship to it has changed quite a bit; I related to Tyler's personal story (which unsurprisingly also references A Modest Proposal as a life-changing polemic):
I thought my own story might be more relatable for friends with a history of devotion – unusual people who’ve found themselves dedicating their lives to a particular moral vision, whether it was (or is) Buddhism, Christianity, social justice, or climate activism. When these visions gobble up all other meaning in the life of their devotees, well, that sucks. I go through my own history of devotion to effective altruism. It’s the story of [wanting to help] turning into [needing to help] turning into [living to help] turning into [wanting to die] turning into [wanting to help again, because helping is part of a rich life].
Your questions come from a frame of altruism as obligatory, and while I feel that force (it's what got me into the movement), I would propose excitement as a healthier more sustainable frame; see Tyler Alterman's story for an example of such a shift
There is no obligation to maximise one's income for donating to impactful charities that necessarily entail a lot of personal sacrifice. There are examples of people who I admire for doing earning to give well, but AFAICT they take the opportunity frame, e.g. Jeff Kaufman and Julia Wise, AGB and Denise Melchin, etc (do correct me if you're reading this and think I misrepresented you?)
The reasoning that top roles would almost certainly be filled by top candidates so there's no point to worrying about them being filled is counterproductive in the aggregate, and ignores that you may be one of those top candidates, which you can only really find out by applying — it's also useful to reframe the job application process as an information-gathering exercise in personal fit, instead of just assuming no-fit (not very evidence-based, that)
You shouldn't be troubled by the dilemma of pursuing a career in harmful industries: to first approximation, just don't do it, there are many reasons why you shouldn't. I'd classify this line of reasoning under the perils of naive maximisation, and note that it's really hard to avoid harm as a fanatic of anything in general (and utilitarianism in particular)
On AI, I'll let others chime in, although I think 80,000 Hours' primer on mitigating AI risks is a solidly comprehensive introduction that should help you understand why many EAs prioritise it, and argue against its specific points / framing etc to be more substantive. The other thing I'd point out is that AI's mindshare on the forum is disproportionate to other proxies for "emphasis", like talent (FTEs) and funding vs other areas, and it's worth clarifying what you have in mind / are concerned about
I also think taking a historical perspective on how the movement emerged may illuminate the AI thing for you — the ideas underpinning EA came not just from the global health & development side via the charity evaluators (Karnofsky, Hassenfeld, etc), but also philosophers (Singer, Parfit, etc) and transhumanists (Bostrom, Yudkowsky, etc), the lattermost of whom had been thinking about the consequences of radical future technological change, in particular events which might drastically curtail humanity's future astronomically-large potential. When MacAskill and Todd created the Center for Effective Altruism as an umbrella org for 80K and GWWC way back when, the "Effective Altruism" part was intended to be a purely descriptive part of CEA's name, but then took a life of its own (becoming a question, an ideology, a social movement that wants to be more question than ideology, etc) that gradually encompassed all these ostensibly disparate ideas under a sort of pluralistic banner of doing good better. Not everyone under this banner agrees with each other
Endnote 2: Why can’t we just defer to existing experts, instead of figuring stuff out for ourselves?
Alternative & complementary response: which experts? Why them, instead of these other experts who disagree with the former? How can you tell if you're (say) being misled? To quote John Wentworth:
When non-experts cannot distinguish true expertise from noise, money cannot buy expertise. Knowledge cannot be outsourced; we must understand things ourselves. ...
King Louis XV of France was one of the richest and most powerful people in the world. He died of smallpox in 1774, the same year that a dairy farmer successfully immunized his wife and children with cowpox. All that money and power could not buy the knowledge of a dairy farmer - the knowledge that cowpox could safely immunize against smallpox. There were thousands of humoral experts, faith healers, eastern spiritualists, and so forth who would claim to offer some protection against smallpox, and King Louis XV could not distinguish the real solution.
John also suggests that the kind of deep model you want to build is gears-level models (that link has a lot of examples across various domains):
If I want to build long-term knowledge-wealth, then the analogy between money-wealth and knowledge-wealth suggests an interesting question: what does a knowledge “investment” look like? What is a capital asset of knowledge, an investment which pays dividends in more knowledge?
Enter gears-level models.
Mapping out the internal workings of a system takes a lot of up-front work. It’s much easier to try random molecules and see if they cure cancer, than to map out all the internal signals and cells and interactions which cause cancer. But the latter is a capital investment: once we’ve nailed down one gear in the model, one signal or one mutation or one cell-state, that informs all of our future tests and model-building. If we find that Y mediates the effect of X on Z, then our future studies of the Y-Z interaction can safely ignore X. On the other hand, if we test a random molecule and find that it doesn’t cure cancer, then that tells us little-to-nothing; that knowledge does not yield dividends.
John has some advice on how to read papers to build gears-level models, although for most situations I prefer Sarah Constantin's advice to do fact-posting.
I spent most of my early career as a data analyst in industry, which engendered in me a deep wariness of quantitative data sources and plumbing, and a neverending discomfort at how often others tended to just take them as given for input into consequential decision-making, even if at an intellectual level I knew their constraints and other priorities justified it and they were doing the best they could. ...and then I moved to global health applied research and realised that the data trustworthiness situation was so much worse I had to recalibrate a lot of expectations / intuitions.
Disease burden estimates, such as child mortality rates, are a key input in our cost-effectiveness analyses. Historically, for consistency and convenience, we've primarily relied on a single source for these estimates.
Going forward, we plan to consider multiple sources for burden estimates, apply a higher level of scrutiny to these estimates, and adjust for potential biases or inaccuracies, like we do when estimating other parameters in our models.
This change has already led to us making over $25m in additional grants we would not have otherwise. (Footnote: Our updated estimates of malaria burden in Chad have led us to allocate $3.3 million in grantmaking for seasonal malaria chemoprevention (more), and $25.9m for insecticide-treated nets (not yet published).) We expect to consider additional research to improve estimates of burden of disease in the future.
The rest of the note was cathartic to skim-read. For instance, when I looked into the idea of distributing low-cost glasses to correct presbyopia in low-income countries awhile back (a problem that afflicts over 1.8 billion people globally with >$50 billion in annual lost potential productivity annually in LMICs alone), the industry data analyst in me was dismayed to learn that the WHO didn't even collect data on how many people needed glasses prior to 2008, so governments and associated stakeholders understandably prioritised allocation of resources towards surgical and medical interventions instead. I think the existence of orgs like IHME and OWID greatly improve the GHD data situation nowadays, but there are many "pockets" where it remains a far cry from what it could be, so I appreciated that GiveWell said they're considering
Fund data collection. This includes potentially funding additional nationally representative surveys (DHS/MIS/MICS) or additional modules to these surveys, or supporting more autopsy data collection to better understand cause-specific mortality, particularly for malaria in sub-Saharan Africa. Our guess is that part of the reason different models disagree is that the data underlying these models is limited. We may look for cases where we could fund additional data collection to improve burden of disease estimates.
Another example: a fair bit of my earlier analyst work involved either reconciling discrepant figures for ostensibly similar metrics (e.g. campaign revenue breakdowns etc) or root-cause analysing-via-data-plumbing whether a flagged metric needed to be acted on or was a false positive, which made me appreciate this section:
Key uncertainties: ...
There are likely technical nuances we haven't captured. We've found that comparisons between sources are more complex than they first appear. For example, we recently learned that IGME and IHME define diarrheal diseases differently. Similar technical differences likely exist elsewhere.
Possible next steps:
Get a better understanding of what’s driving differences in models. This may come from bringing together modeling groups in regions with high disagreement to understand methodological differences.
Look for ways to improve model transparency. We’ve found it difficult to engage with burden of disease models, and think that finding ways to see inside the black box of how they produce estimates may make it easier to understand which estimates to rely on and how to improve them.
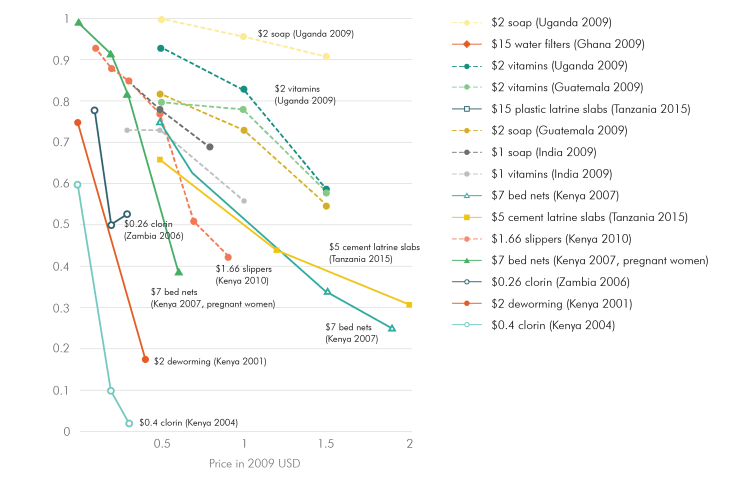
From Rachel Glennerster's old J-PAL blog post, a classic worth resharing: "charge for bednets or distribute them for free?"
In 2000 there was an intense argument about whether malarial insecticide-treated bednets (ITNs) should be given out for free. Some argued that charging for bednets would massively reduce take-up by the poor. Others argued that if people don’t pay for something, they don’t value it and are less likely use it. It was an evidence-free argument at the time.
Then, a series of studies in many countries testing many different preventative health products showed that even a small increase in price led to a sharp decline in product take-up. Pricing did not help target the product to those who needed it most, and people were not more likely to use a product if they paid for it. This cleared the way for a massive increase in free bednet distribution (Dupas 2011 and Kremer and Glennerster 2011).
There was a dramatic increase in malaria bednet coverage between 2000 and 2015 in sub-Saharan Africa. At the same time, there was a massive fall in the number of malarial cases. In Nature, Bhatt and colleagues estimate that the vast majority of the decline in malarial cases is due to the increase in ITNs. They estimate there were 450 million fewer cases of malaria due to ITNs and four million fewer deaths due to ITNs. The lesson here is that testing an important policy-relevant idea can have as much impact on peoples’ lives as testing a specific program.
Thanks for elaborating David, I think I better understand where you're coming from now. I still don't buy the need to incorporate these costs though, so in the interest of potentially changing my mind and to prevent talking past each other let me try to be concrete.
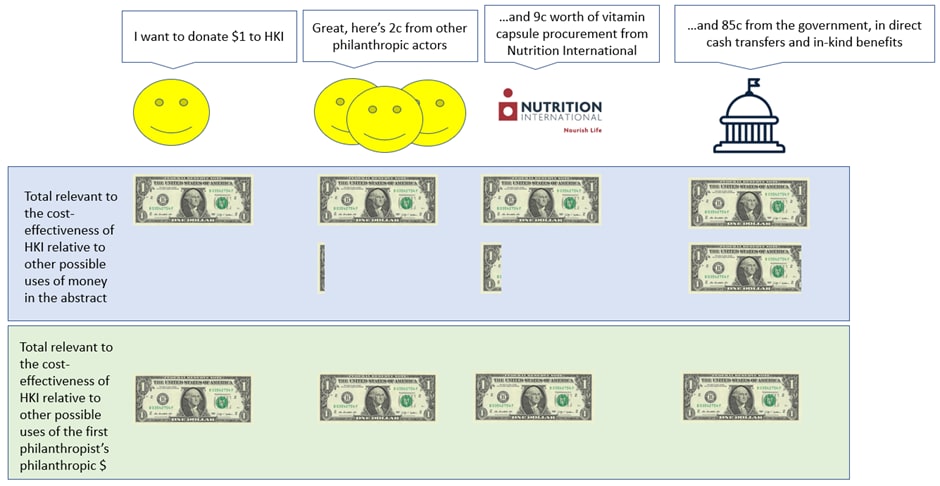
The model reports the effectiveness of an intervention per philanthropic dollar spent, but this is (subtly) incorrect. The decision problem facing GiveWell is not exactly finding the most cost-effective charity per philanthropic dollar, but rather finding the most cost-effective charity that my philanthropic dollar can contribute towards. So, the cost-effectiveness of a particular charity per dollar I personally donate ought to be the effectiveness that that dollar brings, plus any matched additional philanthropic funding that dollar generates – but I’ve still only spent one dollar when it comes to the ‘cost’ part of ‘cost-effectiveness’. The idea is that you might abstractly be interested in the total cost of an intervention vs its effects, or even the total philanthropic cost of an intervention vs its effects, but GiveWell is concretely interested in the good done by a marginal donation, so only the first actor matters. Hopefully the diagram below illuminates more than it confuses!
Applying this approach to (say) Lafiya Nigeria's figures, Rethink Priorities estimates that if you donated $361 and Lafiya spent it in Q1 '25 you would have averted one additional death in expectation. Supposing you included costs from other orgs like WHO etc, sure the total cost may increase, but it's still the case that your $361 helped avert one additional death in expectation! You could think of those other overhead costs as "leveraged funding" or "other people's money moved by your money" or whatever, but why would any of that be relevant to the fact that an additional death was averted because you decided to donate $361? Shouldn't that averted death be what ultimately matters?
Maybe you're thinking from a credit attribution perspective? e.g. you want to say "yes a life was spared, but I shouldn't get all the credit, since my money moved WHO's money etc, so if we did proper accounting (maybe using Shapley values) maybe I can only get 40% credit for averting that neonatal death or averting that woman from dying in childbirth, whereas WHO gets 30% credit and other actors get 30% credit". But in that case I don't see where this over-focus on credit attribution is coming from, instead of just wanting to avert the death of that child or mother and knowing that you the donor can do so by giving Lafiya $361?
Kelsey Piper is a journalist at Vox. Leah Libresco Sargeant is a journalist. Colin Aitken is a postdoctoral scholar in development economics at the University of Chicago. Alex Randall is a foreign aid and procurement expert. Bruce Tsai is a doctor. Dave Kasten is a consultant. Zac Hatfield-Dodds is a fellow of the Python Software Foundation. Keller Scholl is a PhD candidate in policy analysis. Clara Collier is the Editor in Chief at Asterisk. Rishi Mago is a software engineer at Amazon.
We speak only for ourselves and our consciences. None of our respective institutions have reviewed this work. Alex was formerly employed by a USAID contractor that received PEPFAR funding. She did not work directly on PEPFAR programs. We thank Emily Lin for serving as our Webmaster. We are indebted to a number of external reviewers, including Saloni Dattani and Andrew Martin.
Buried deep in the PEPFAR Report's appendix - methodology section is a nice "introduction to global health programs" mini-article that also addresses some lay misconceptions about foreign aid and suggests a better way to think about it all in one go; it's a shame that most folks won't read it, so I'm reposting it here for ease of future reference.
Introduction to Global Health Programs
Many people are skeptical of foreign aid and other attempts to help the global poor—and they’re right to be! A lot of foreign aid is poorly targeted, counterproductive, or simply a waste of money. From PlayPumps to TOMS shoes to One Laptop Per Child, the news is full of well-intentioned programs that had nowhere near the effect their boosters advertised. Many prominent experts, such as William Easterly and Angus Deaton, question whether foreign aid works at all.
Development economists, charity evaluators, and other specialists perform “program evaluations,” which ask questions like:
Does the problem we’re trying to solve actually exist?
Why does the problem exist?
Is the program well-implemented?
Is the program having the effect that we expected?
Is the program too expensive? Can some other program get the same results for less money?
In general, program evaluations are interested in finding out what the effects of a program are. The effect of a program is the difference between the outcome (what actually happened) and the counterfactual (what would have happened without the program being implemented). It’s impossible to measure the counterfactual because the counterfactual is about the same people at the same time. The counterfactual can only ever be estimated. Program evaluators have come up with many different ways of estimating the counterfactual, which we’ll talk about on the main page.
Researchers have found that global health interventions are far more likely to work than programs like PlayPumps or One Laptop Per Child. It’s easy to be wrong about whether a school system needs laptops, especially in a country far away from your own; it’s much harder to be wrong about whether a country has sky-high rates of HIV/AIDS. We don’t know much about the causes of poverty or what makes countries develop economically; we know much more about the causes of HIV and what makes HIV progress to AIDS. PlayPumps were a brand-new invention that might not work; antiretroviral medications are well-tested, well-understood, and widely used in the developed world. For this reason, the charity evaluator GiveWell—which specializes in cost-effective ways of helping the global poor—mostly recommends charities that provide healthcare.
Foreign aid often has unintended consequences: for example, giving people shoes (like TOMS shoes did) can put local shoemakers out of work; foreign aid can lead to governments prioritizing the wishes of foreign donors over the wishes of their own people. Providing healthcare has many fewer negative unintended consequences than other forms of foreign aid: providing antiretrovirals is unlikely to put small local antiretroviral manufacturers out of work. It can have some other unintended consequences, like loss of democratic accountability.
Poverty in America is horrible: no one should be unsure how to pay for rent, food, or healthcare. But Americans are extraordinarily rich compared to the rest of the world: a person at the poverty line in the United States is in the top 15% wealthiest people in the world, even if you adjust for how far money goes in each country. Many of the world’s poorest people live in the countries PEPFAR works in: about two-fifths of people in sub-Saharan Africa live on less than $2.15 a day, adjusted for how far money goes. Since these people are so poor, they don’t have many of the opportunities Americans take for granted. Of course, the first priority of the United States government should be to help American citizens. But if you’re used to charity at home, it can be shocking how cheap it is to help people abroad.
Most of all: just throwing money at foreign aid doesn’t fix anything. But that isn’t a reason to give up—not with millions of lives at stake. If we’re careful and thoughtful, and if we actually check whether what we’re doing does any good, then we don’t have to be PlayPumps or TOMS shoes. We can concretely, robustly make things better.
Martin Gould's Five insights from farm animal economics over at Open Phil's FAW newsletter points out that (quote) "blocking local factory farms can mean animals are farmed in worse conditions elsewhere":
Consider the UK: Local groups celebrateblocking new chicken farms. But because UK chicken demand keeps growing — it rose 24% from 2012-2022 — the result of fewer new UK chicken farms is just that the UK imports more chicken: it almost doubled its chicken imports over the same time period. While most chicken imported into the UK comes from the EU, where conditions for chickens are similar, a growing share comes from Brazil and Thailand, where regulations are nonexistent. Blocking local farms may slightly reduce demand via higher prices, but it also risks sentencing animals to worse conditions abroad.
The same problem haunts government welfare reforms — stronger standards in one country can just shift production to places with worse standards.
This reminded me of what Will MacAskill wrote in Doing Good Better on anti-sweatshop protests being potentially misguided because the alternative for sweatshop workers is worse (long quote):
... those who protest sweatshops by refusing to buy goods produced in them are making the mistake of failing to consider what would happen otherwise. In developing countries, sweatshop jobs are the good jobs. The alternatives are typically worse, such as backbreaking, low-paid farm labor, scavenging, or unemployment.
A clear indicator that sweatshops provide comparatively good jobs is the great demand for them among people in developing countries. Almost all workers in sweatshops chose to work there, and some go to great lengths to do so. In the early 2000s, nearly four million people from Laos, Cambodia, & Burma immigrated to Thailand to take sweatshop jobs, and many Bolivians risk deportation by illegally entering Brazil in order to work in the sweatshops there. The average earnings of a sweatshop worker in Brazil are $2,000/year — not very much, but $600/year more than the average earnings in Bolivia, where people generally work in agriculture or mining. Similarly, the average earnings among sweatshop workers are: $2/day in Bangladesh, $5.50/day in Cambodia, $7/day in Haiti, and $8/day in India. These wages are tiny, but when compared to the $1.25 a day many citizens of these countries live in, the demand for these jobs seem more understandable.
It’s difficult for us to imagine that people would risk deportation just to work in sweatshops. But that’s because the extremity of global poverty is almost unimaginable.
Among economists, there’s no question that sweatshops benefit those in poor countries and that they are ‘tremendous good news for the world’s poor.’ One said, ‘My concern is not that there are too many sweatshops but that there are too few.’ Low-wage, labor-intensive manufacturing is a stepping-stone that helps an economy based around cash crops develop into an industrialized, rich country. During the Industrial Revolution, for example, Europe and America spent more than 100 years using sweatshop labor, emerging with much higher living standards as a result. It took many decades to pass through this stage because the tech to industralize was new, and the 20th century has seen countries pass through this stage of development much more rapidly because the tech is already in place. The four East Asian ‘Tiger economies’ — Hong Kong, Singapore, South Korea, and Taiwan — exemplify speedy development, having evolved from very poor, agrarian societies in the early 20th century to manufacturing-oriented sweatshop countries mid-century, and finally emerging as industrialized economic powerhouses in recent decades. Because sweatshops are good for poor countries, if we boycott them, we make people in poor countries worse off.
We should certainly feel outrage and horror at the conditions sweatshop laborers toll under. The correct response, however, is not to give sweatshop-produced goods in favor of domestically produced goods. The correct response is to try to end the extreme poverty that makes sweatshops desirable places to work in the first place. What about buying products from companies that employ people in poor countries but claim to have higher labor standards, like People Tree, Indigenous, and Kuyichi? By doing this, we would avoid the use of sweatshops, while at the same time providing even better job opportunities for the extreme poor.
This made me wonder about 2 things:
Zooming out: if you buy that the two examples above form a natural category (of "noble intentions misguided by poor reasoning about counterfactuals / second-order effects", say), what other examples are there of such altruistic mistakes that we might be making?
Zooming in: what kind of intervention is analogous to "buy from People Tree" in the FAW context? Is this a promising avenue at all?
I know very little about FAW, but I'd guess the answer to #2 is "not promising" mainly because it isn't what advocates do. Instead, and again quoting from Gould's writeup, they do this:
... advocates are getting smarter about this. They're pushing for laws that tackle both production and imports at once. US states like California have done this — when it banned battery cages, it also banned selling eggs from hens caged anywhere. The EU is considering the same approach. It's a crucial shift: without these import restrictions, both farm bans and welfare reforms risk exporting animal suffering to places with even worse conditions. And advocates have prioritized corporate policies, which avoid this problem, as companies pledge to stop selling products associated with the worst animal suffering (like caged eggs), regardless of where they are produced.

A few quick reactions in case they're helpful: