Summary
- Many of the high-level results remain similar to the previous (2022) EA Survey:
- The factors most commonly cited as having the largest positive impact on respondents’ ability to have an impact remain personal connections (42.3%) and 80,000 Hours (34.1%), followed by EAG / EAGx (combined; 22.9%), GiveWell (19.0%), and EA groups (18.2%)
- For highly engaged EAs specifically, personal connections (60.9%), EAG / EAGx (combined; 35.7%), 80,000 Hours (31.9%), and EA Groups (23.8%) remain among the most important factors for having an impact
- The factors most commonly cited as the most important sources of valuable new personal connections were EAG / EAGx (combined; 31.6%), personal connections (30.8%), and EA Groups (28.2%).
- The factors most commonly cited as having the largest positive impact on respondents’ ability to have an impact remain personal connections (42.3%) and 80,000 Hours (34.1%), followed by EAG / EAGx (combined; 22.9%), GiveWell (19.0%), and EA groups (18.2%)
- However, we note some changes over time:
- More respondents indicated that “none of these options” led to an interesting new personal connection (30.6% compared to 19.0% in 2022 and 12.2% in 2020). This led to a commensurate reduction in the numbers selecting several other categories, including the Other category (12.2% vs 23.4% and 24.8%).
- We also highlight some additional, new results examining which factors were important for EAs who joined more or less recently:
- Among recent EA cohorts (i.e., respondents who recently got involved in EA), several factors are cited as being particularly important for having an impact, including the 80,000 Hours website, 80,000 Hours one-on-one career discussions, virtual programs, and the EA Opportunities Board
- Other factors are cited less frequently among recent cohorts, such as personal contact with EAs, GiveWell, and EAG
- Regarding making new and available connections, 80,000 Hours is more frequently cited as a source for among recent EA cohorts while EA Global is cited less frequently
- Several other sources also seem to be selected more often by recent cohorts, except by the most recent cohorts. These sources include local EA groups, EA books, Global Challenges Project, and the EA Newsletter.
Introduction
In this post, we report on what factors and sources EA Survey 2024 respondents say helped them have a positive impact or create new connections.
This post follows two other posts on the results from the most recent EA Survey, one on demographics and one on which factors help EAs get involved in EA. As mentioned in these posts, there are several caveats to keep in mind when interpreting the results, such as those related to how likely the results are likely to be representative of the EA community as a whole. For more on this, please see the introduction of the first post.
In this post we cover the results of two questions from the EA Survey. The first question is about which factors, within the last 12 months, had the largest positive influence on one’s personal ability to have an impact. The second question is about which sources led to making an interesting and valuable new personal connection in the last year. Both questions have been asked, with some variations, since 2020, so this post will include comparisons to previous survey years, as well as comparisons between demographic groups and engagement. Posts on the results of previous EA Surveys regarding these questions can be found here and here.
Positive Influences
Respondents were asked which factors, within the last 12 months, had the largest influence on their personal ability to have a positive impact. They could choose among multiple options such as personal contact with EAs and 80,000 Hours (split up into multiple factors related to 80,000 Hours). Respondents could select any number of factors, selecting an average of 2.69 factors, a median of 2, and a mode of 1.
Below we report, for each factor, the percentage that each factor was selected among respondents who selected at least one factor. We also created two additional categories that combined several factors together:
- 80,000 Hours (combined): consisting of all 80,000 Hours-related factors, including the 80,000 Hours website, podcast, job board, and one-on-one career discussion
- EAG / EAGx (combined): consisting of the EA Global and EAGx factor
The graph below shows the results.
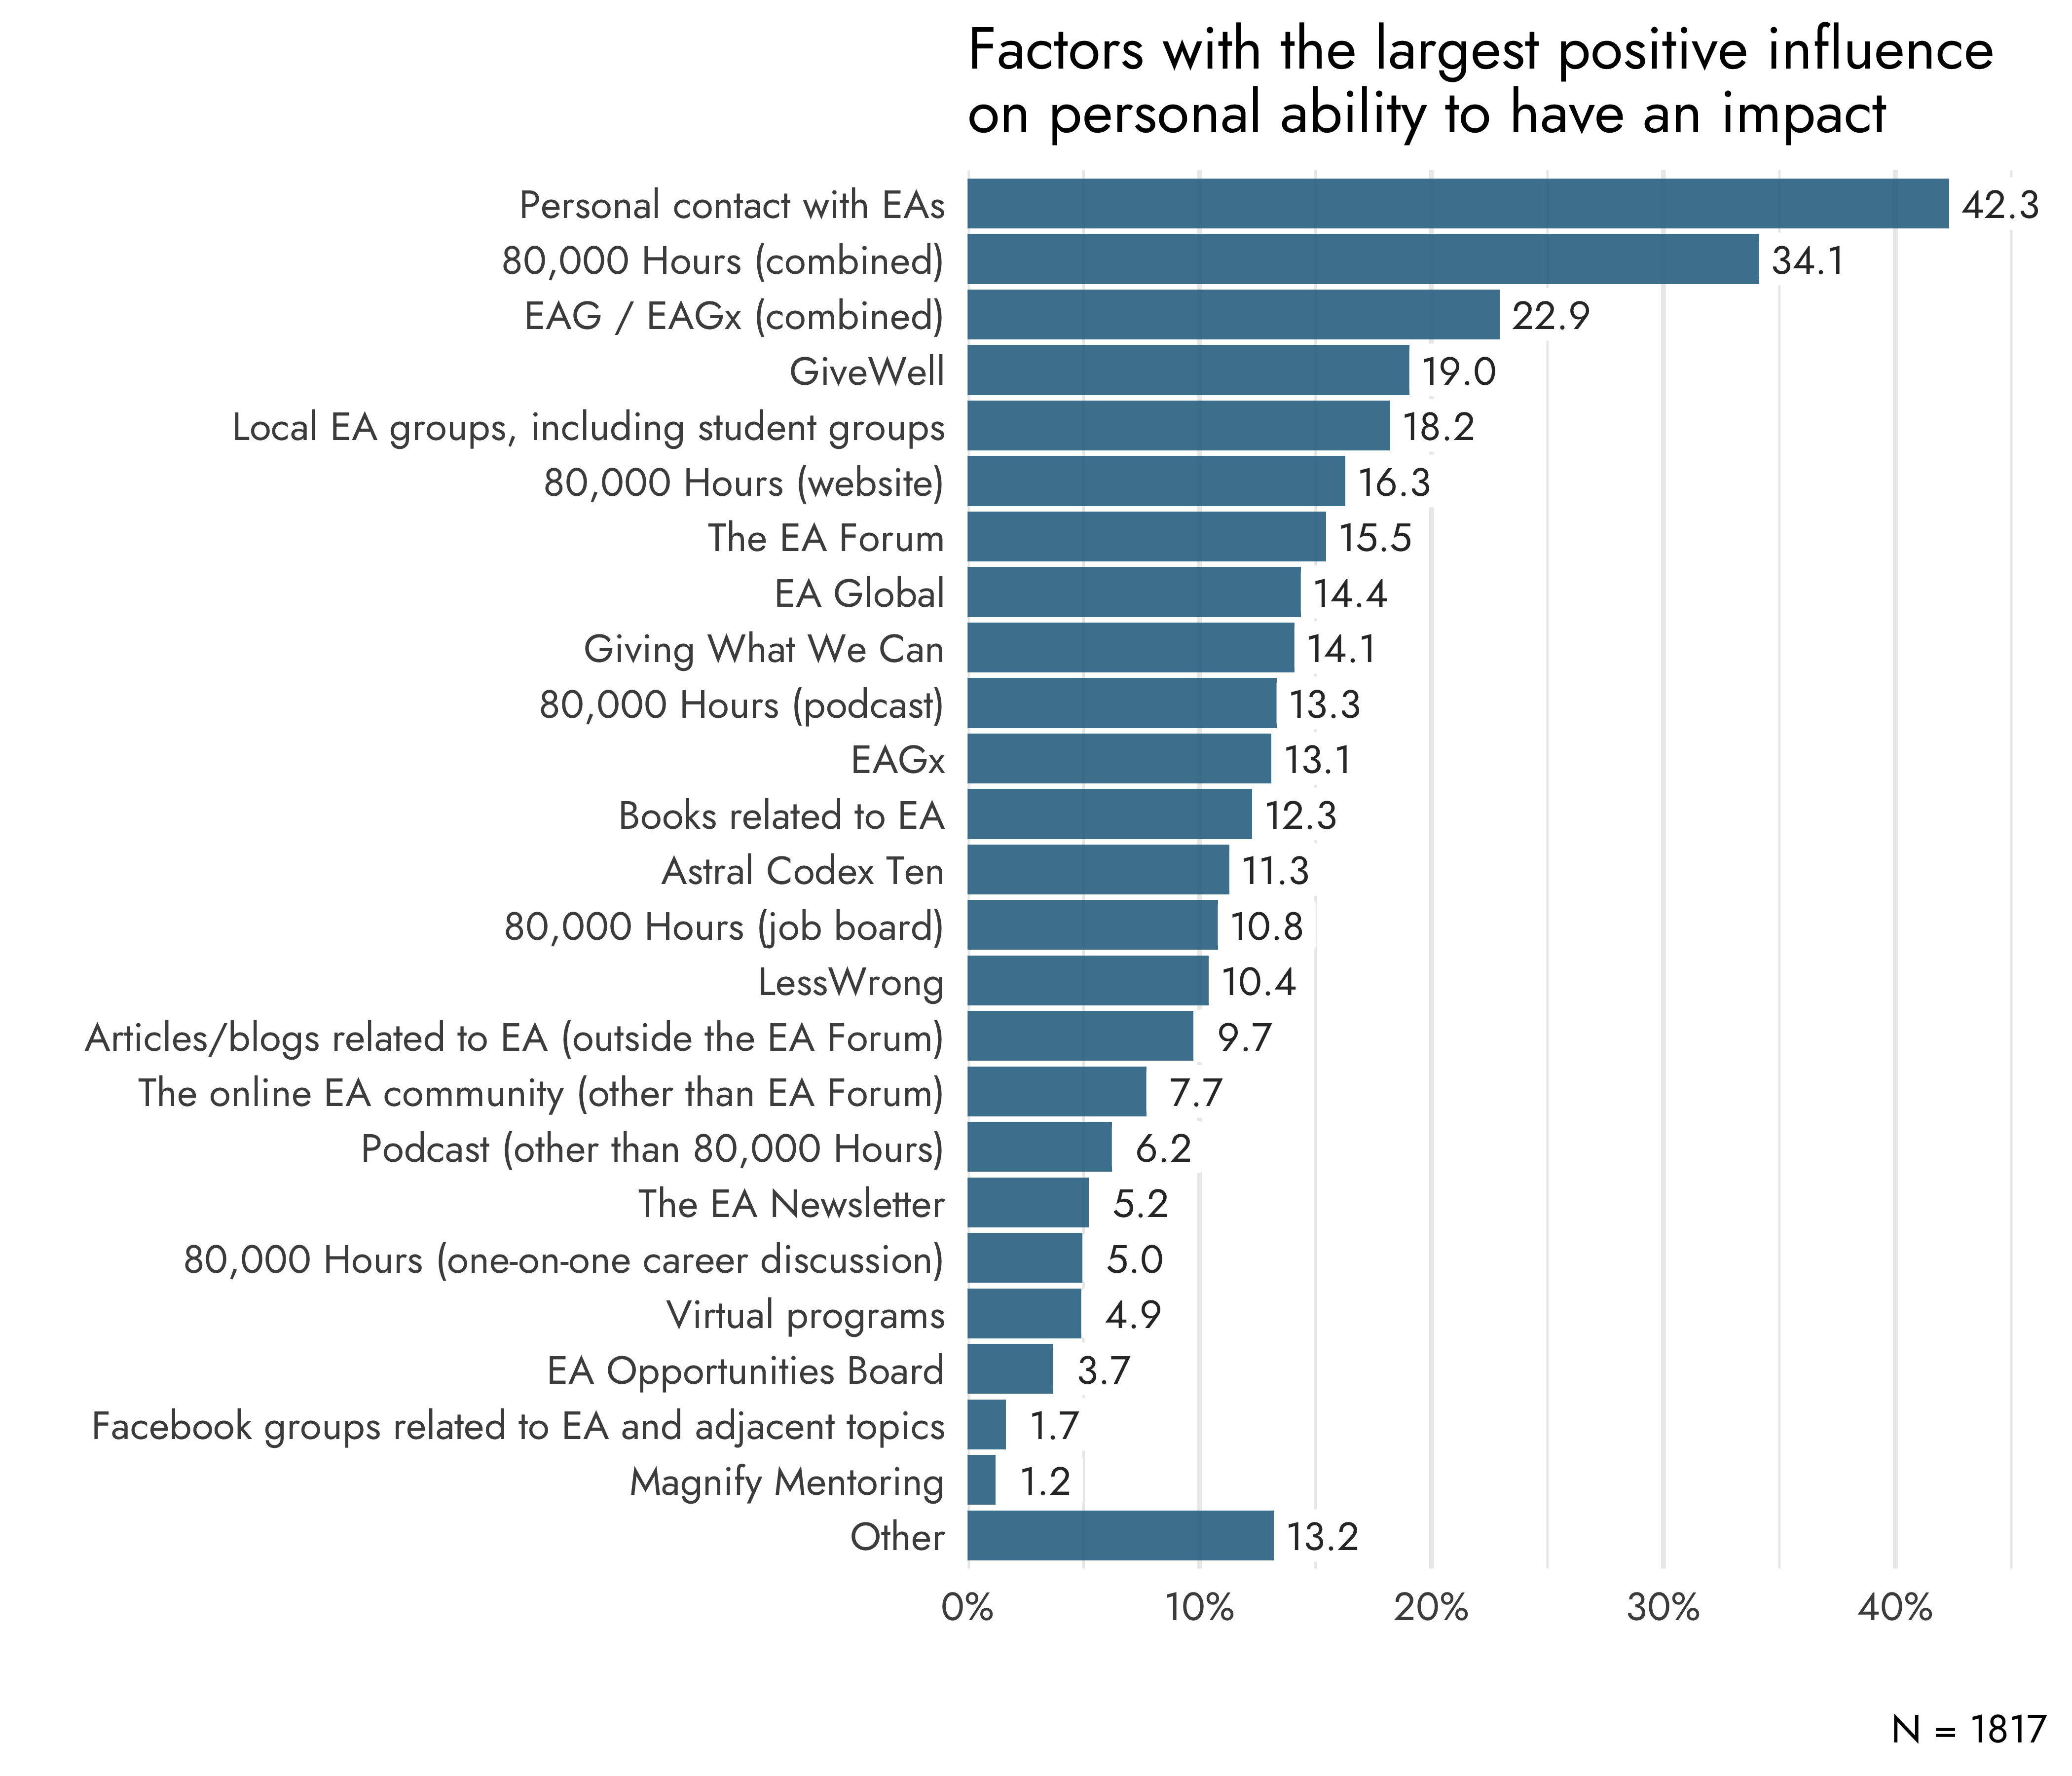
The most frequently selected factors were personal contact by EAs (42.3%), the combined 80,000 Hours category (34.1%), and the combined EAG / EAGx category (22.9%). This was followed by GiveWell (19.0%) and local EA groups (18.2%).
Changes across time
As mentioned above, the question about influences on one’s personal ability to have impact had been asked in previous EA Surveys, starting in 2020. There have, however, been some rather substantial changes to the question between the different years[1]. From 2020 to 2022, the question was changed to include a specific timeframe (‘within the last 12 months’)[2]. Then, from 2022 to 2024, the question was changed to allow respondents to select any number of options, rather than a maximum of three.
These changes make the comparisons between years more difficult, likely resulting in lower proportions for various sources from 2020 to 2022 and an increase in proportions for factors from 2022 to 2024. Indeed, in 2020 there were an average of 3.18 selections per respondent and 2.36 in 2022, compared to 2.69 in the current year.
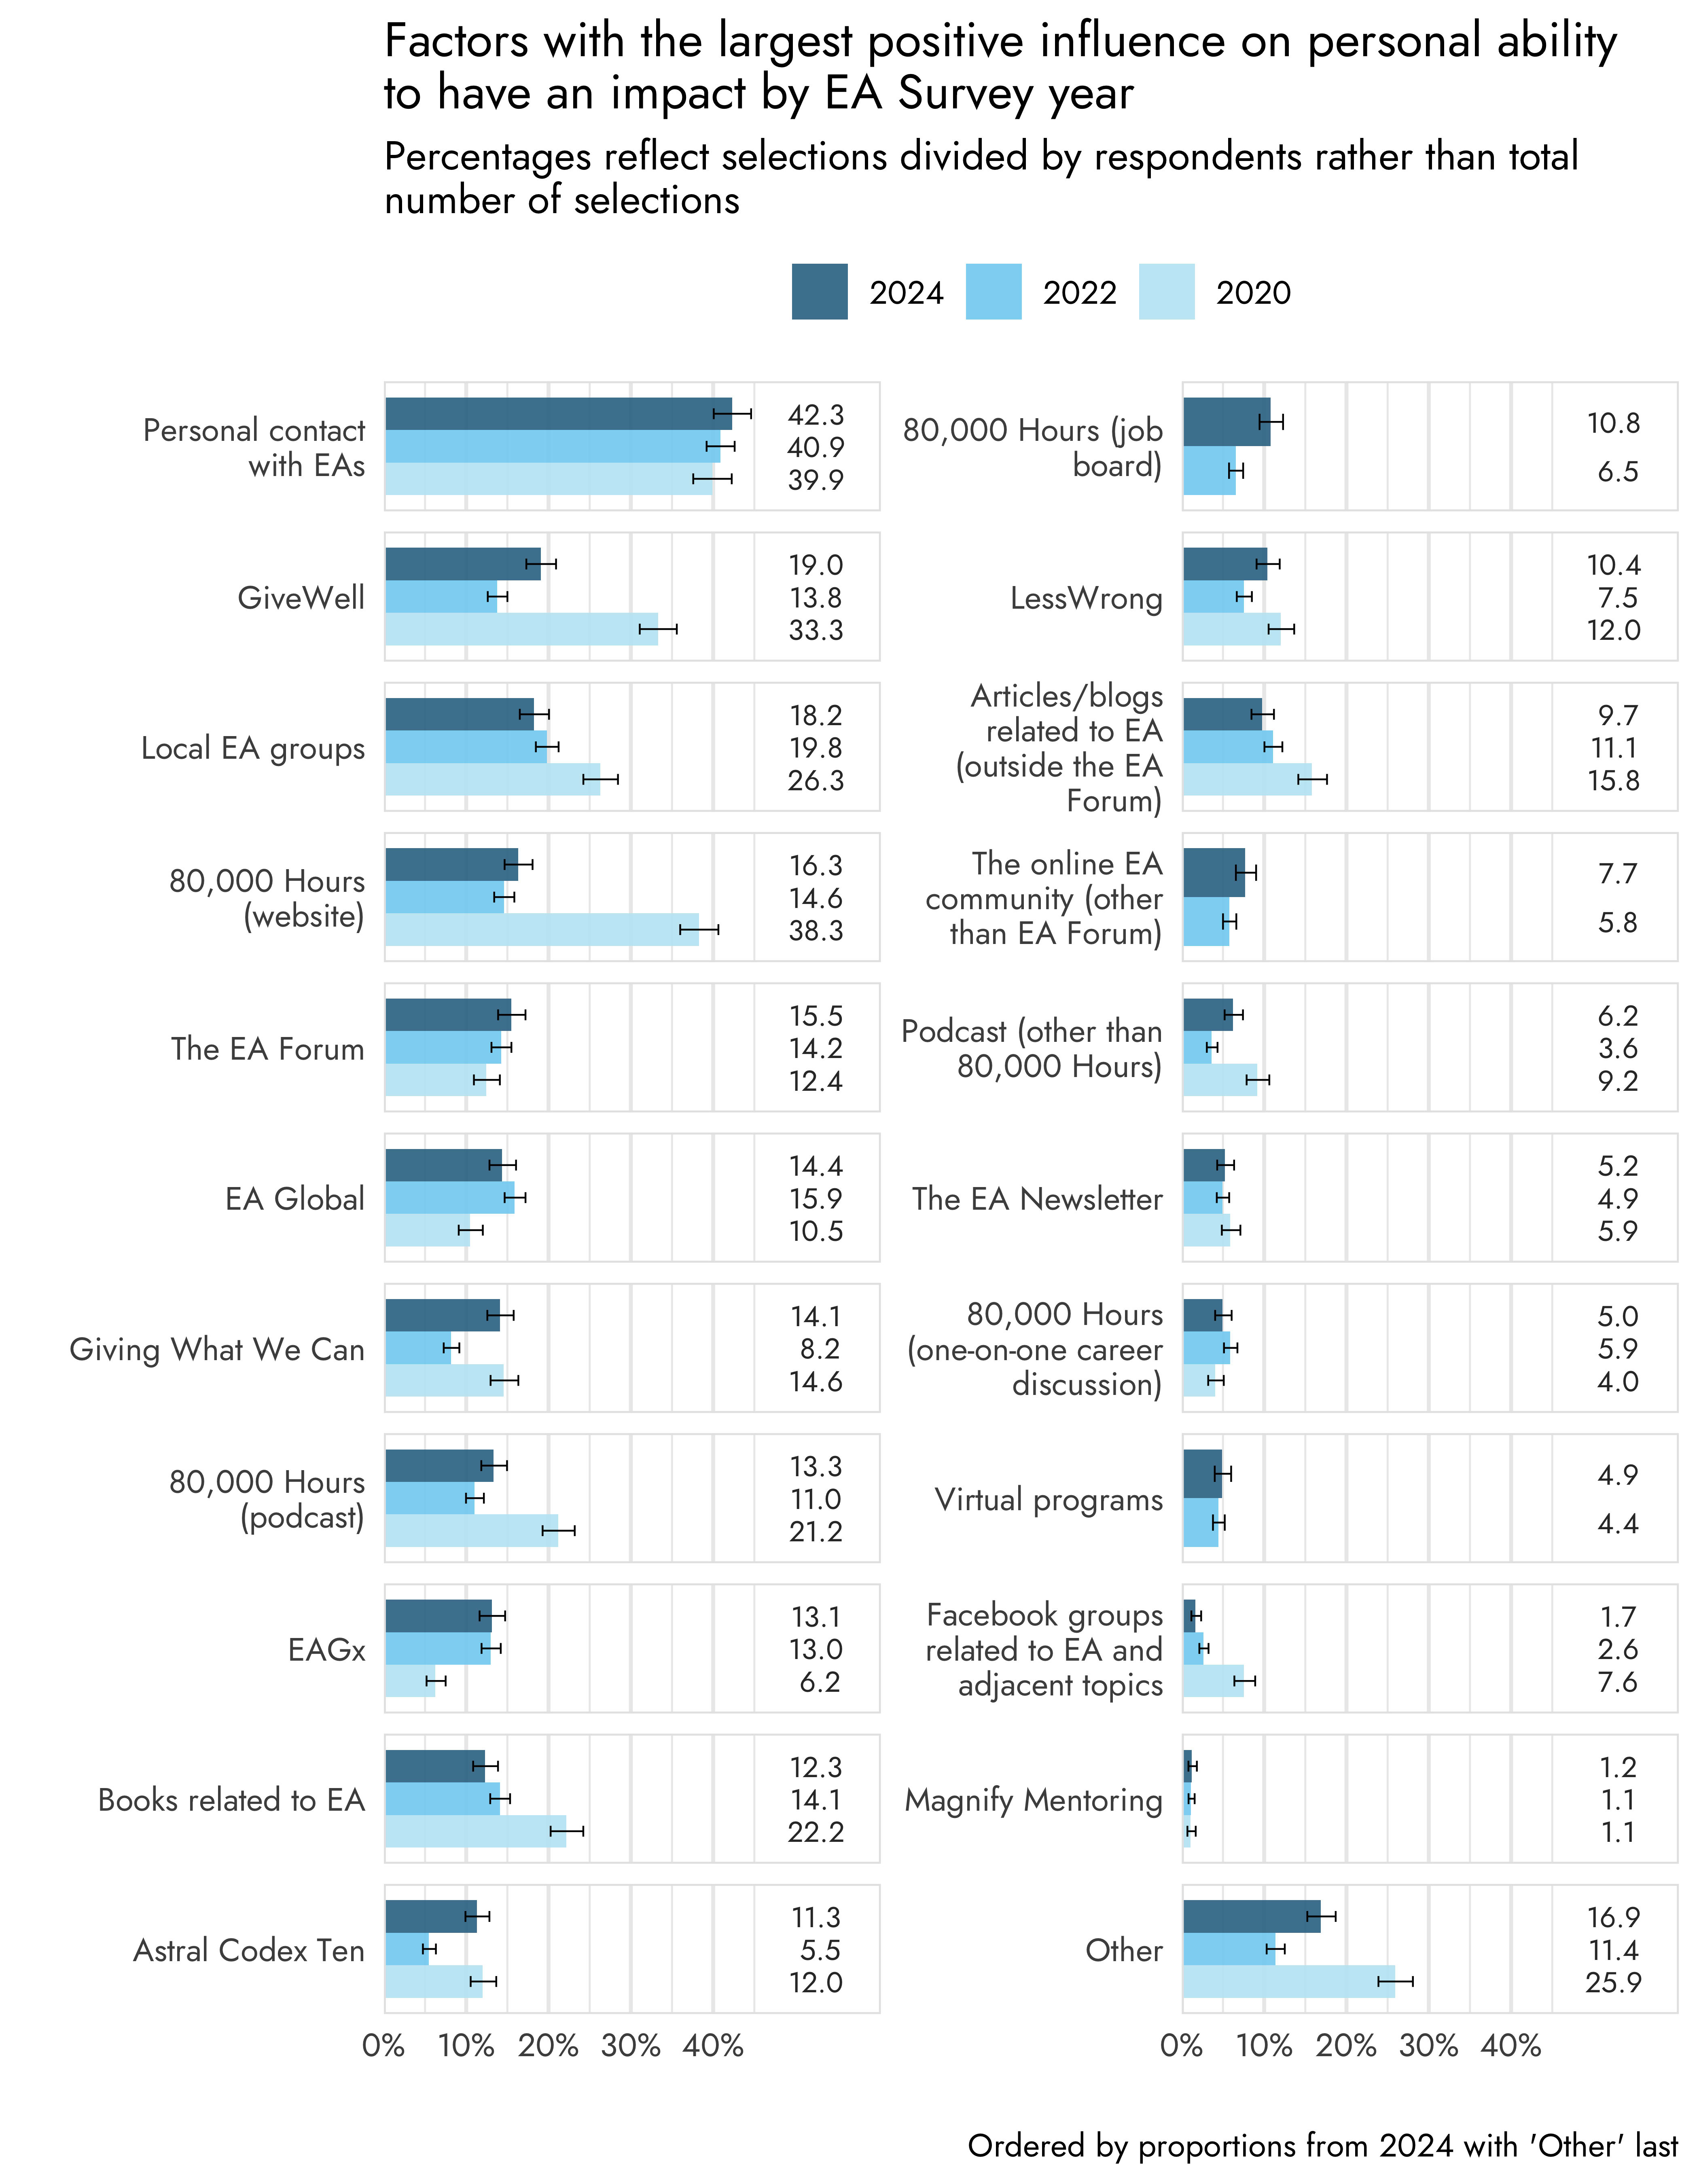
Therefore, to make the results more comparable, we standardized the results for the year-over-year comparisons by dividing the number of times a particular factor was picked by the total number of selections rather than the number of respondents. For a graph showing the proportions divided by the number of respondents, see Appendix 1).
As comparisons between 2020 and 2022 have already been made in a previous post (see here), we focus our comments on comparing the results for 2022 and 2024.
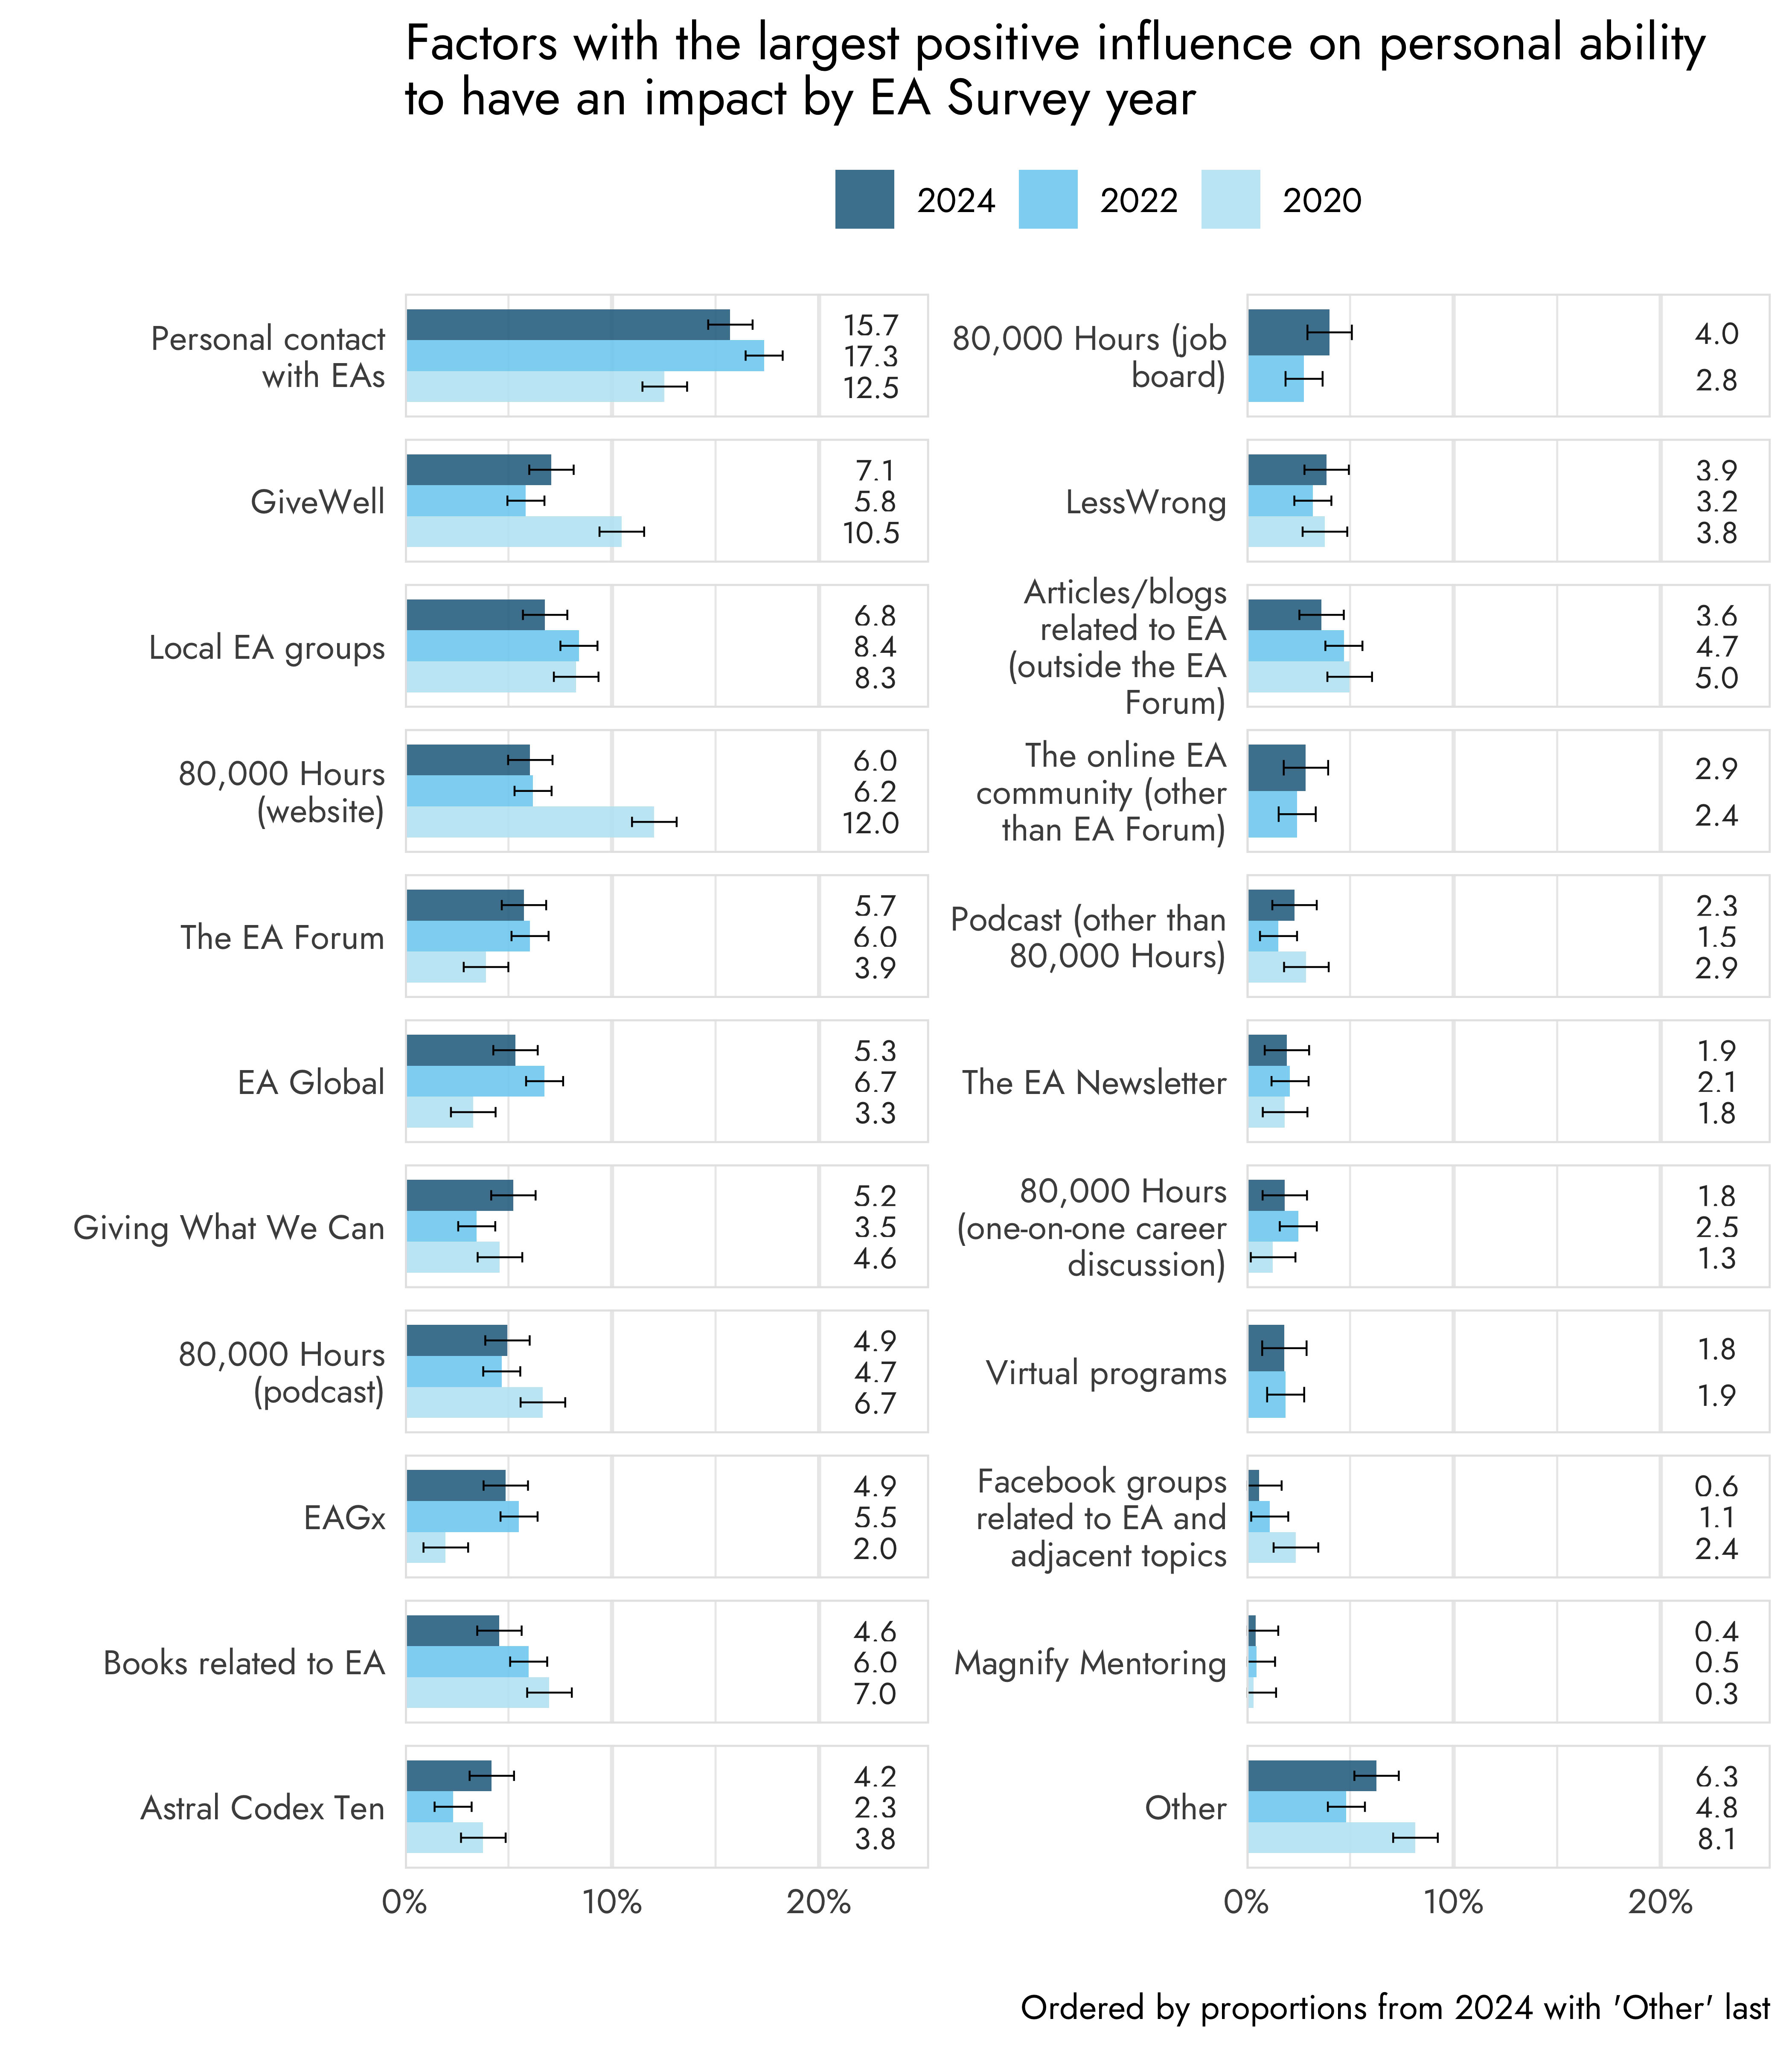
No big differences were found compared to 2022. Some factors were picked slightly more frequently, such as Astral Codex Ten (from 2.3% to 4.2%), Giving What We Can (3.5% to 5.2%), the 80,000 Hours job board (from 2.8% to 4%), GiveWell (5.8% to 7.1%), and podcasts (1.5% to 2.3%).
Other factors were picked slightly less frequently than before, including local EA groups (from 8.4% to 6.8%), personal contact with EAs (17.3% to 15.7%), books (6% to 4.6%), EA Global (6.7% to 5.3%), articles/blogs (4.7% to 3.6%), 80,000 Hours one-on-ones (2.5% to 1.8%) and Facebook groups (1.1% to 0.6%).
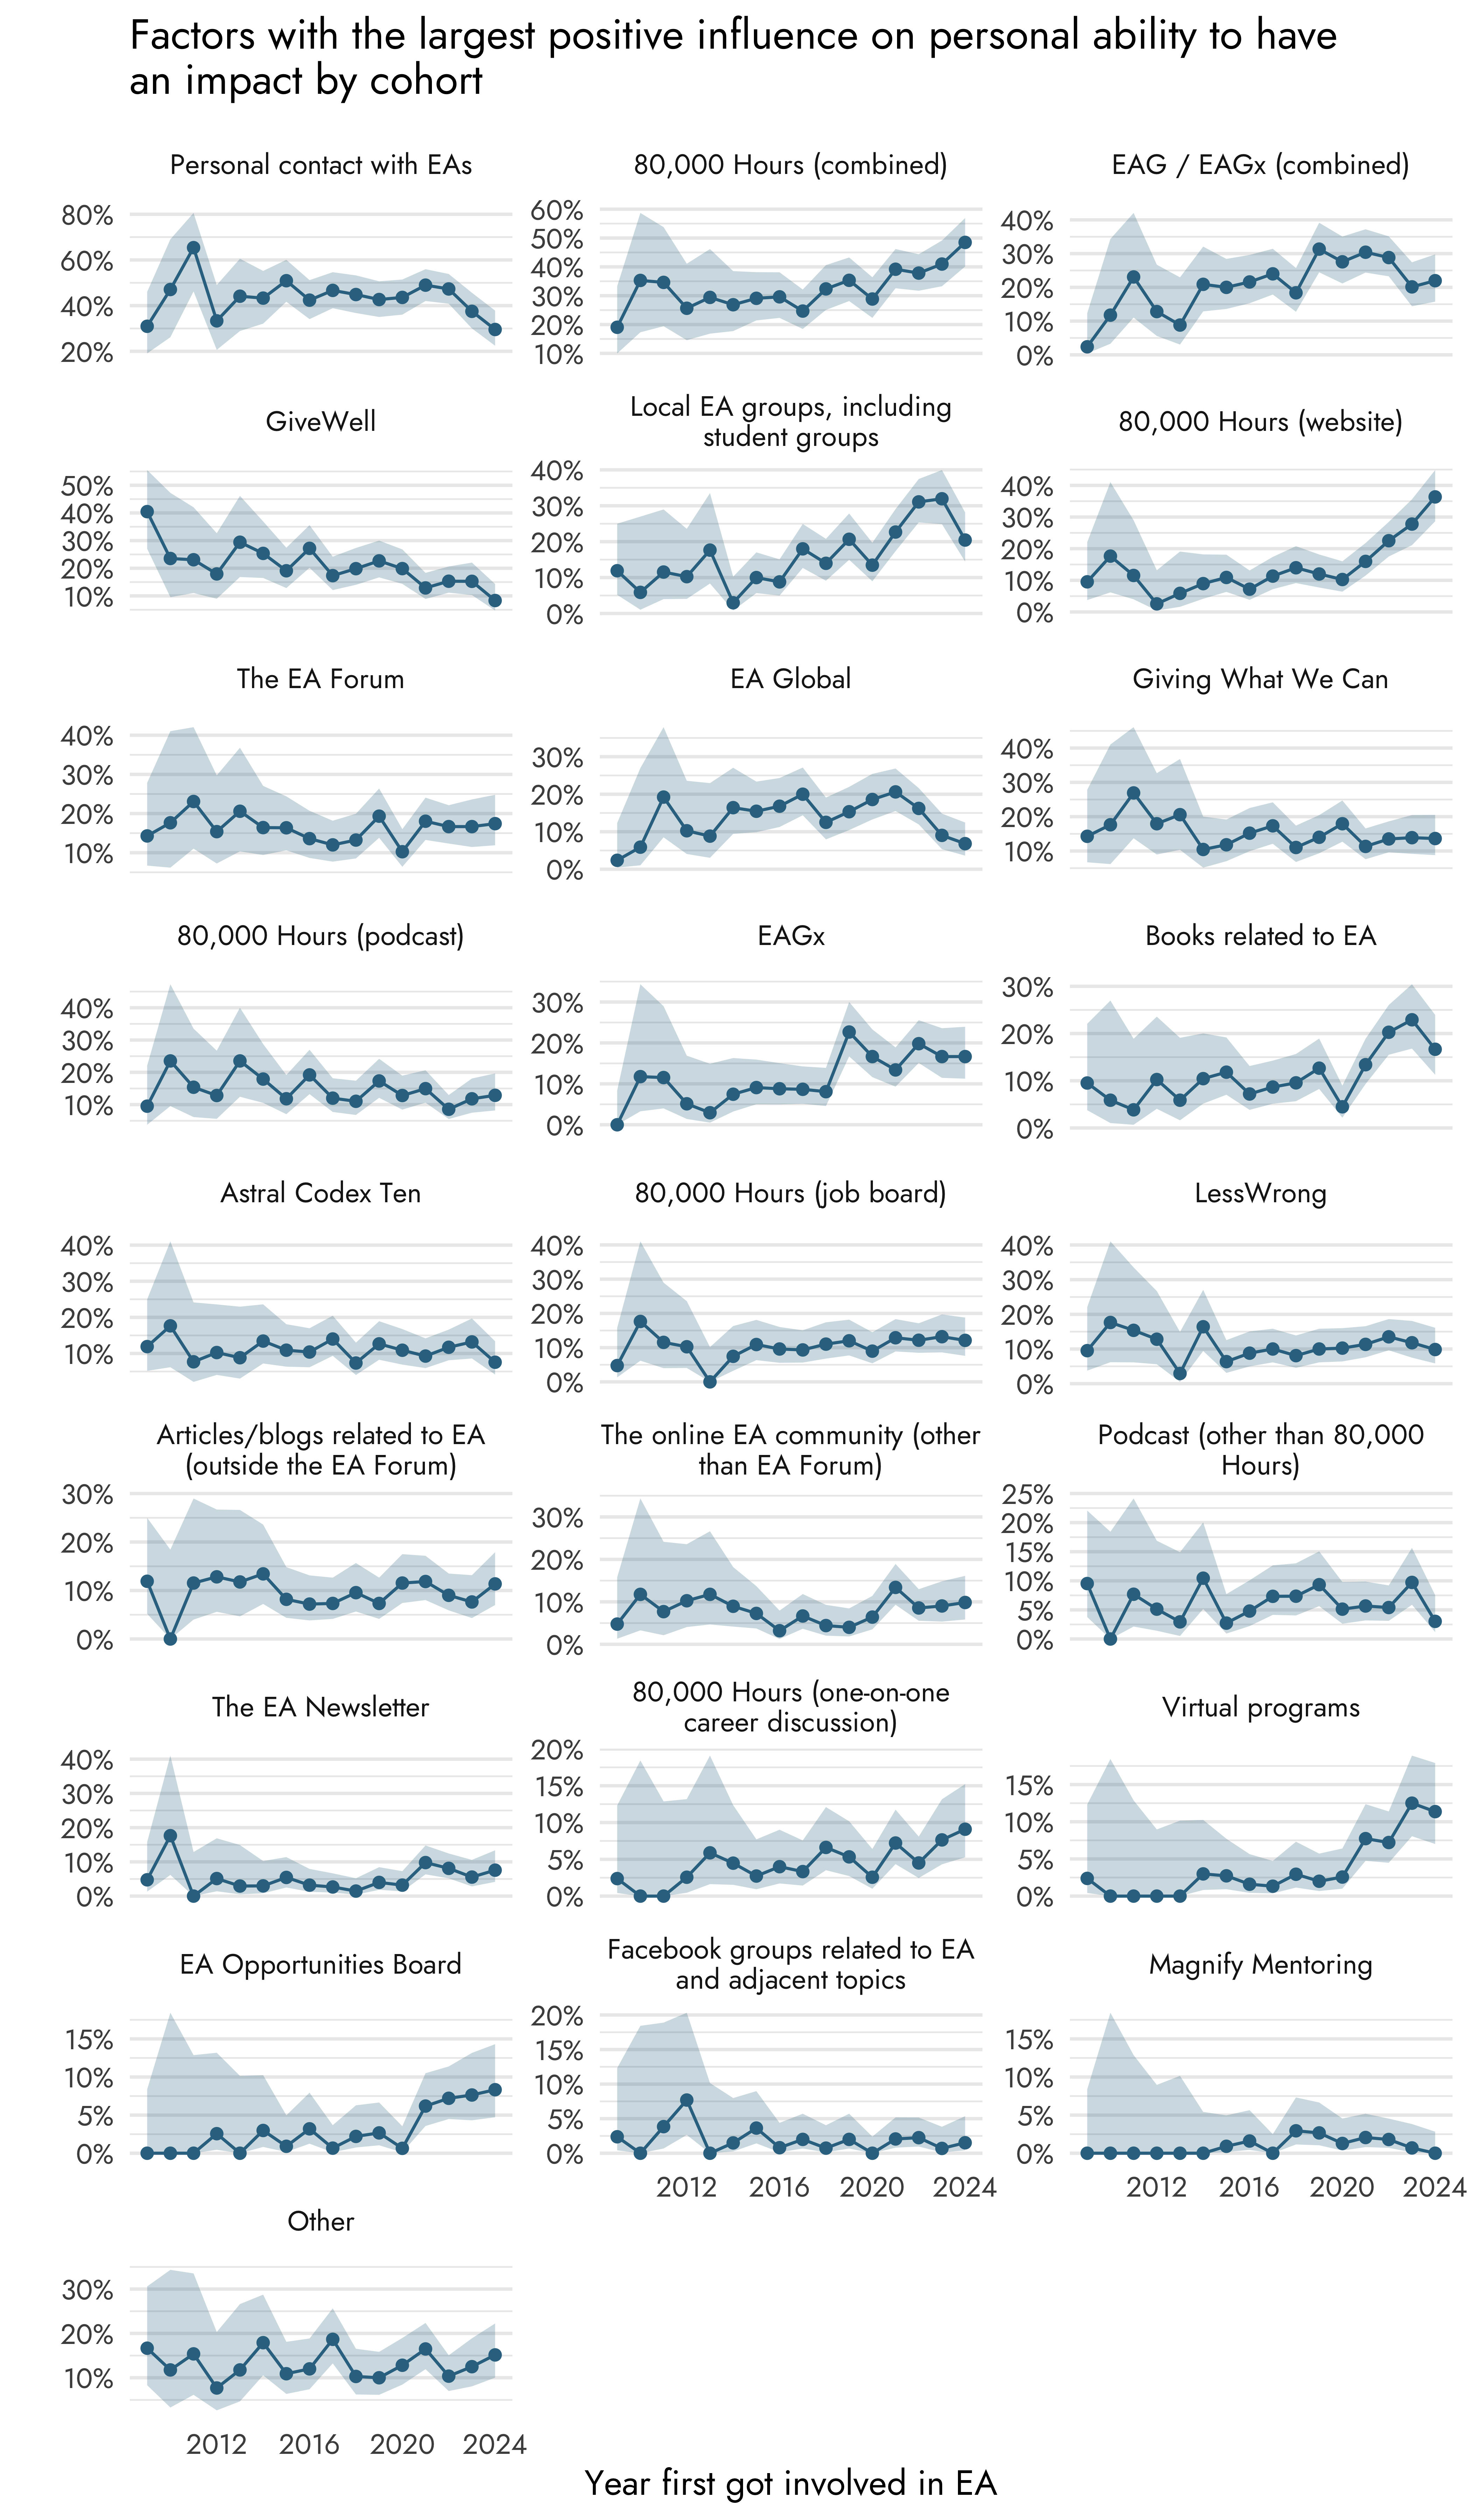
Another approach is to look at differences across different cohorts of EA respondents (i.e., EAs who first got involved in EA in different years). These changes are shown in the graph below (for a graph with a variable y-axis that more clearly shows small differences, see Appendix 2). It’s important to note that these differences across cohorts don’t necessarily reflect increases or decreases in the importance of different factors over time. Often, they will reflect a static tendency for certain factors to disproportionately help EAs who are newer to the community, while others disproportionately help EAs who have engaged for a longer time. (It can be helpful to compare these results with differences based on level of engagement with EA to contextualize this).
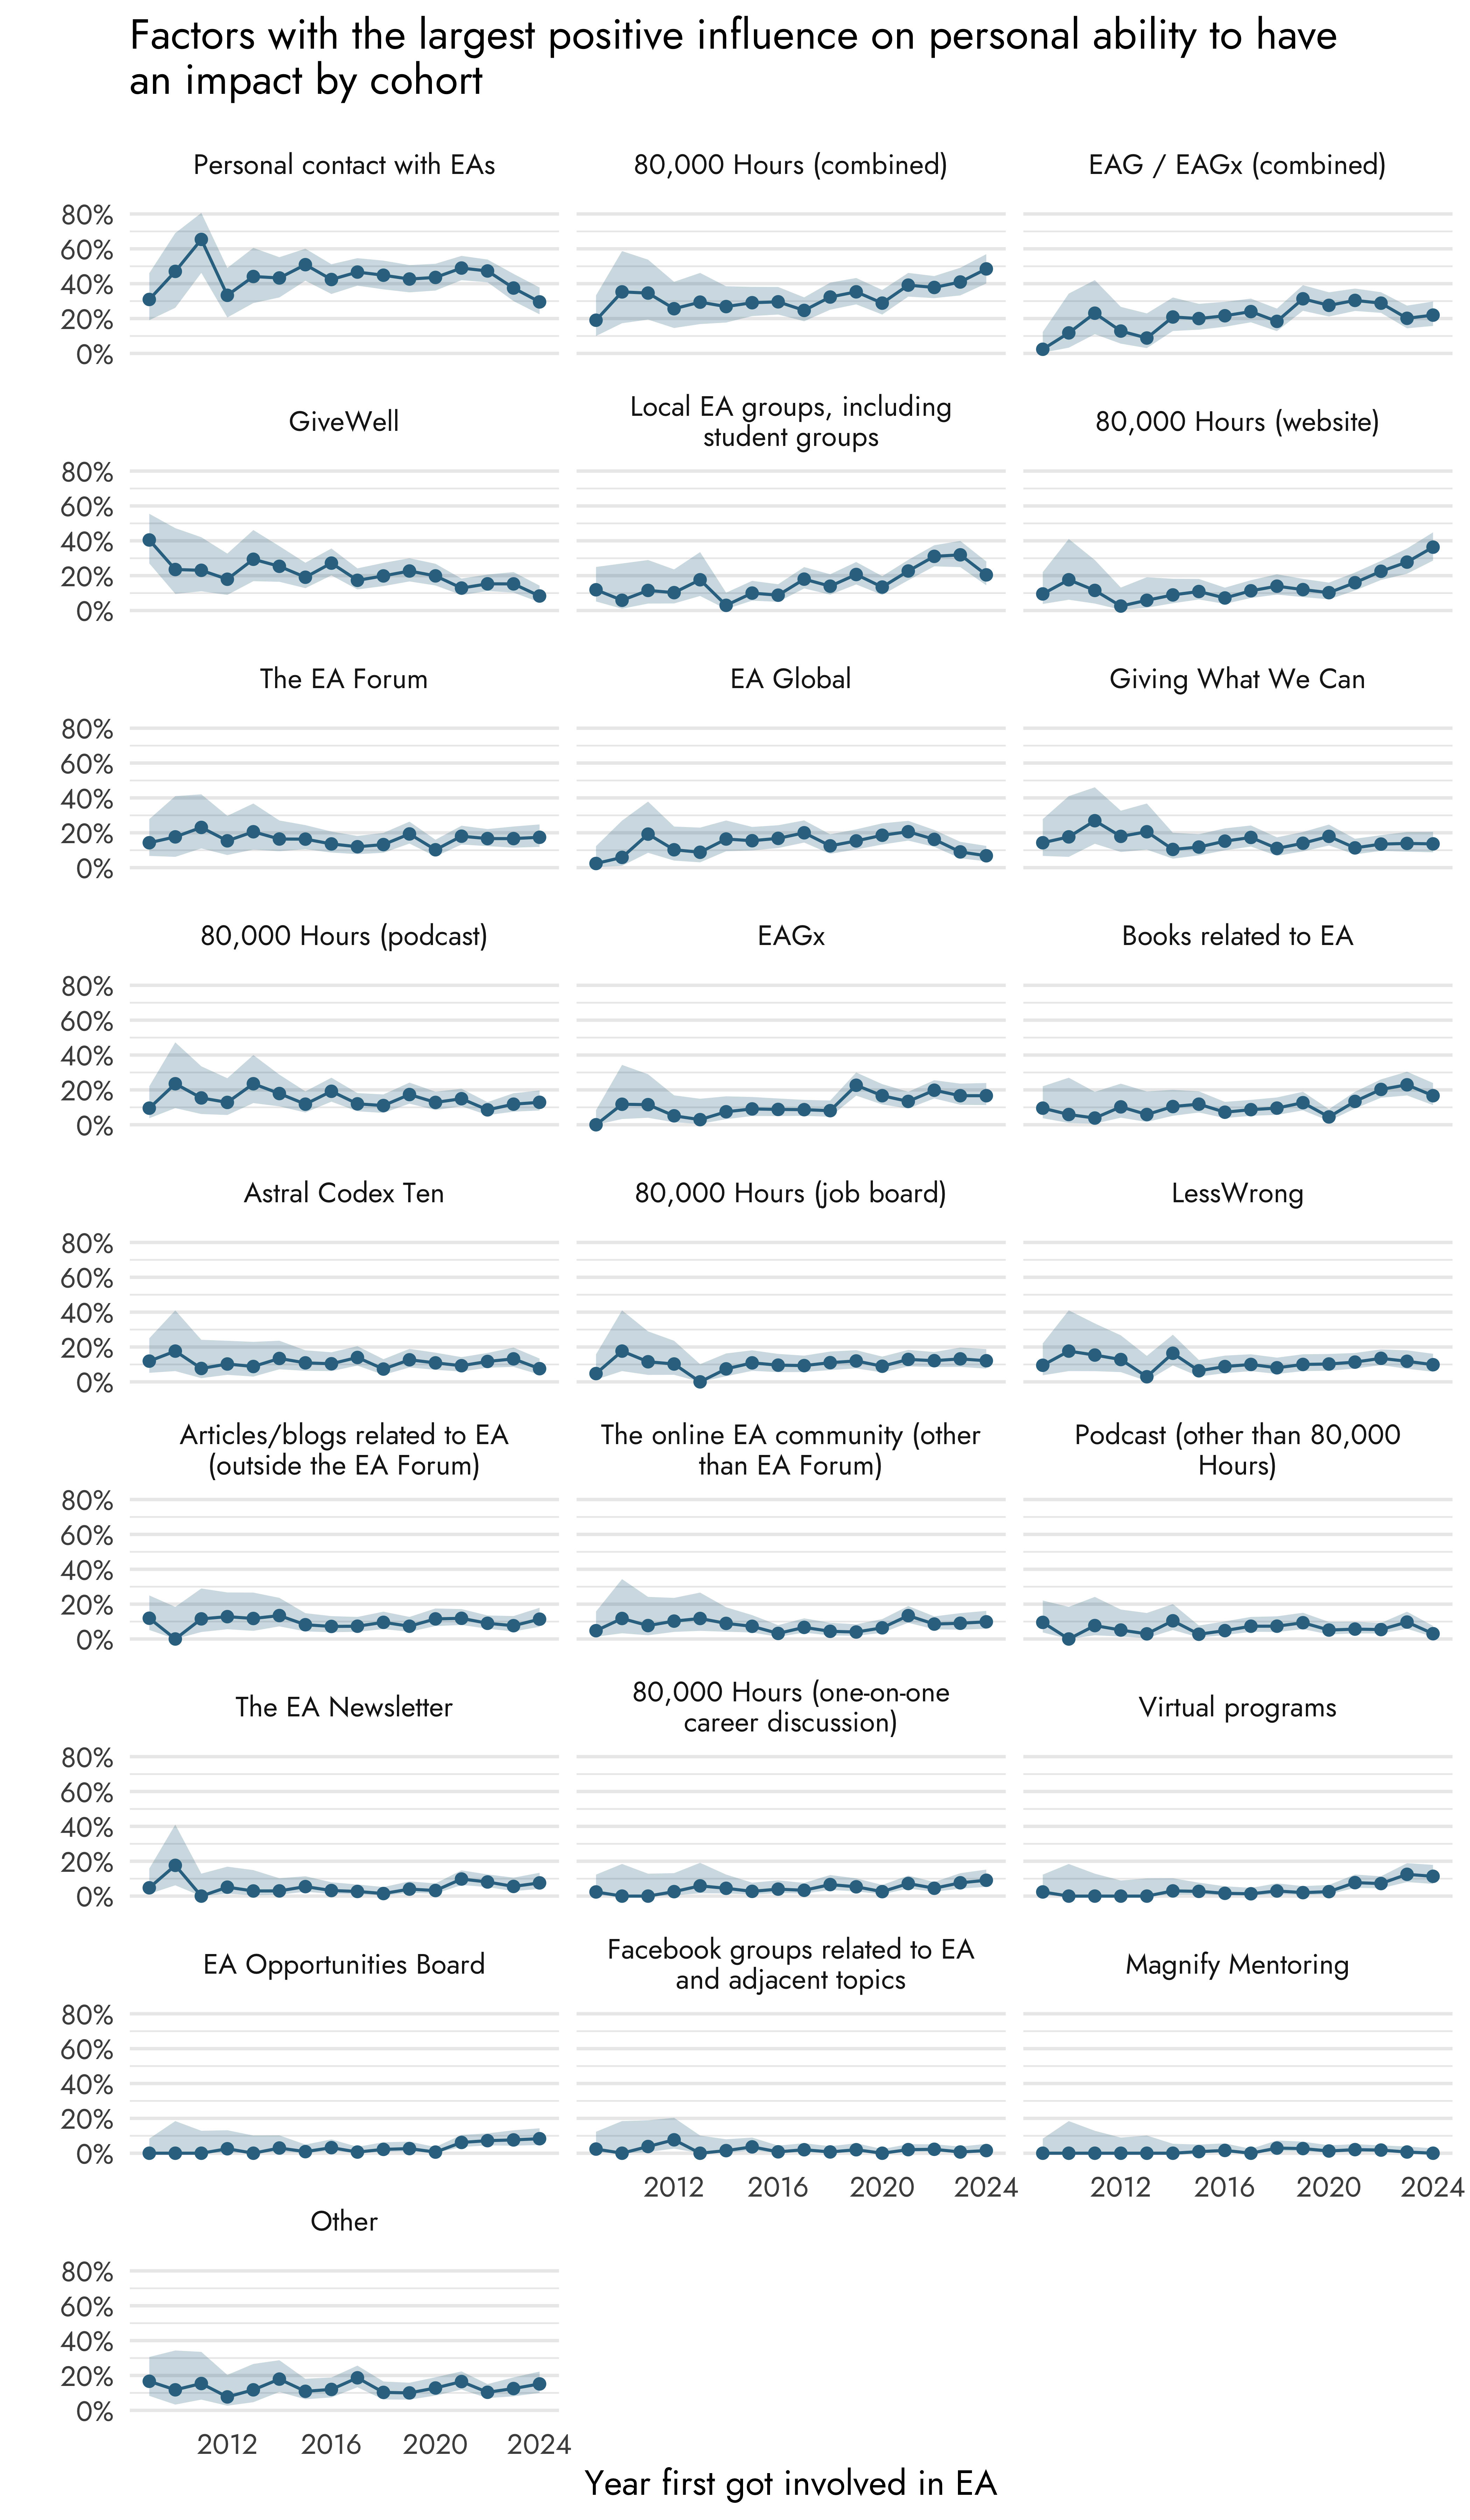
Between cohorts, we see a decrease in personal contact with EAs between the most recent cohorts and older cohorts. Among older cohorts, this factor was selected by ~40% of the respondents, compared to 30% in the most recent cohort. There also appears to be a decrease in selecting local EA groups between the most recent cohort (20%) and cohorts from 2022 and 2023 (~31%). EA Global, too, shows a decrease among recent cohorts (2020-2024), though EAGx is selected more frequently in younger cohorts (2019-2024) compared to older cohorts. Finally, more recent cohorts are less likely to select GiveWell as an important factor.
Various other factors show opposite patterns. The combined 80,000 Hours category is selected more frequently in more recent cohorts, which seems to be driven by more recent cohorts selecting their website as an important factor, as well as one-on-one career discussions, although to a lesser extent. Virtual programs and the EA Opportunities Board are also selected more frequently by respondents from more recent cohorts, as well as EA books.
Group differences
We looked at group differences in two different ways. One, we created graphs in which the factors are sorted by how often each factor was selected in order to show the most important factors for each group. Second, we compared, for each factor, whether there appears to be a difference between groups. As in previous posts, we looked at gender, racial/ethnic identity, and engagement levels.
Gender
In terms of which factors are the most important for each gender category, we see an overlap in factors such as personal contact with EAs, 80,000 Hours (combined), EAG and EAGx (combined). These factors are in the top three for each gender category, as seen in the graph below.
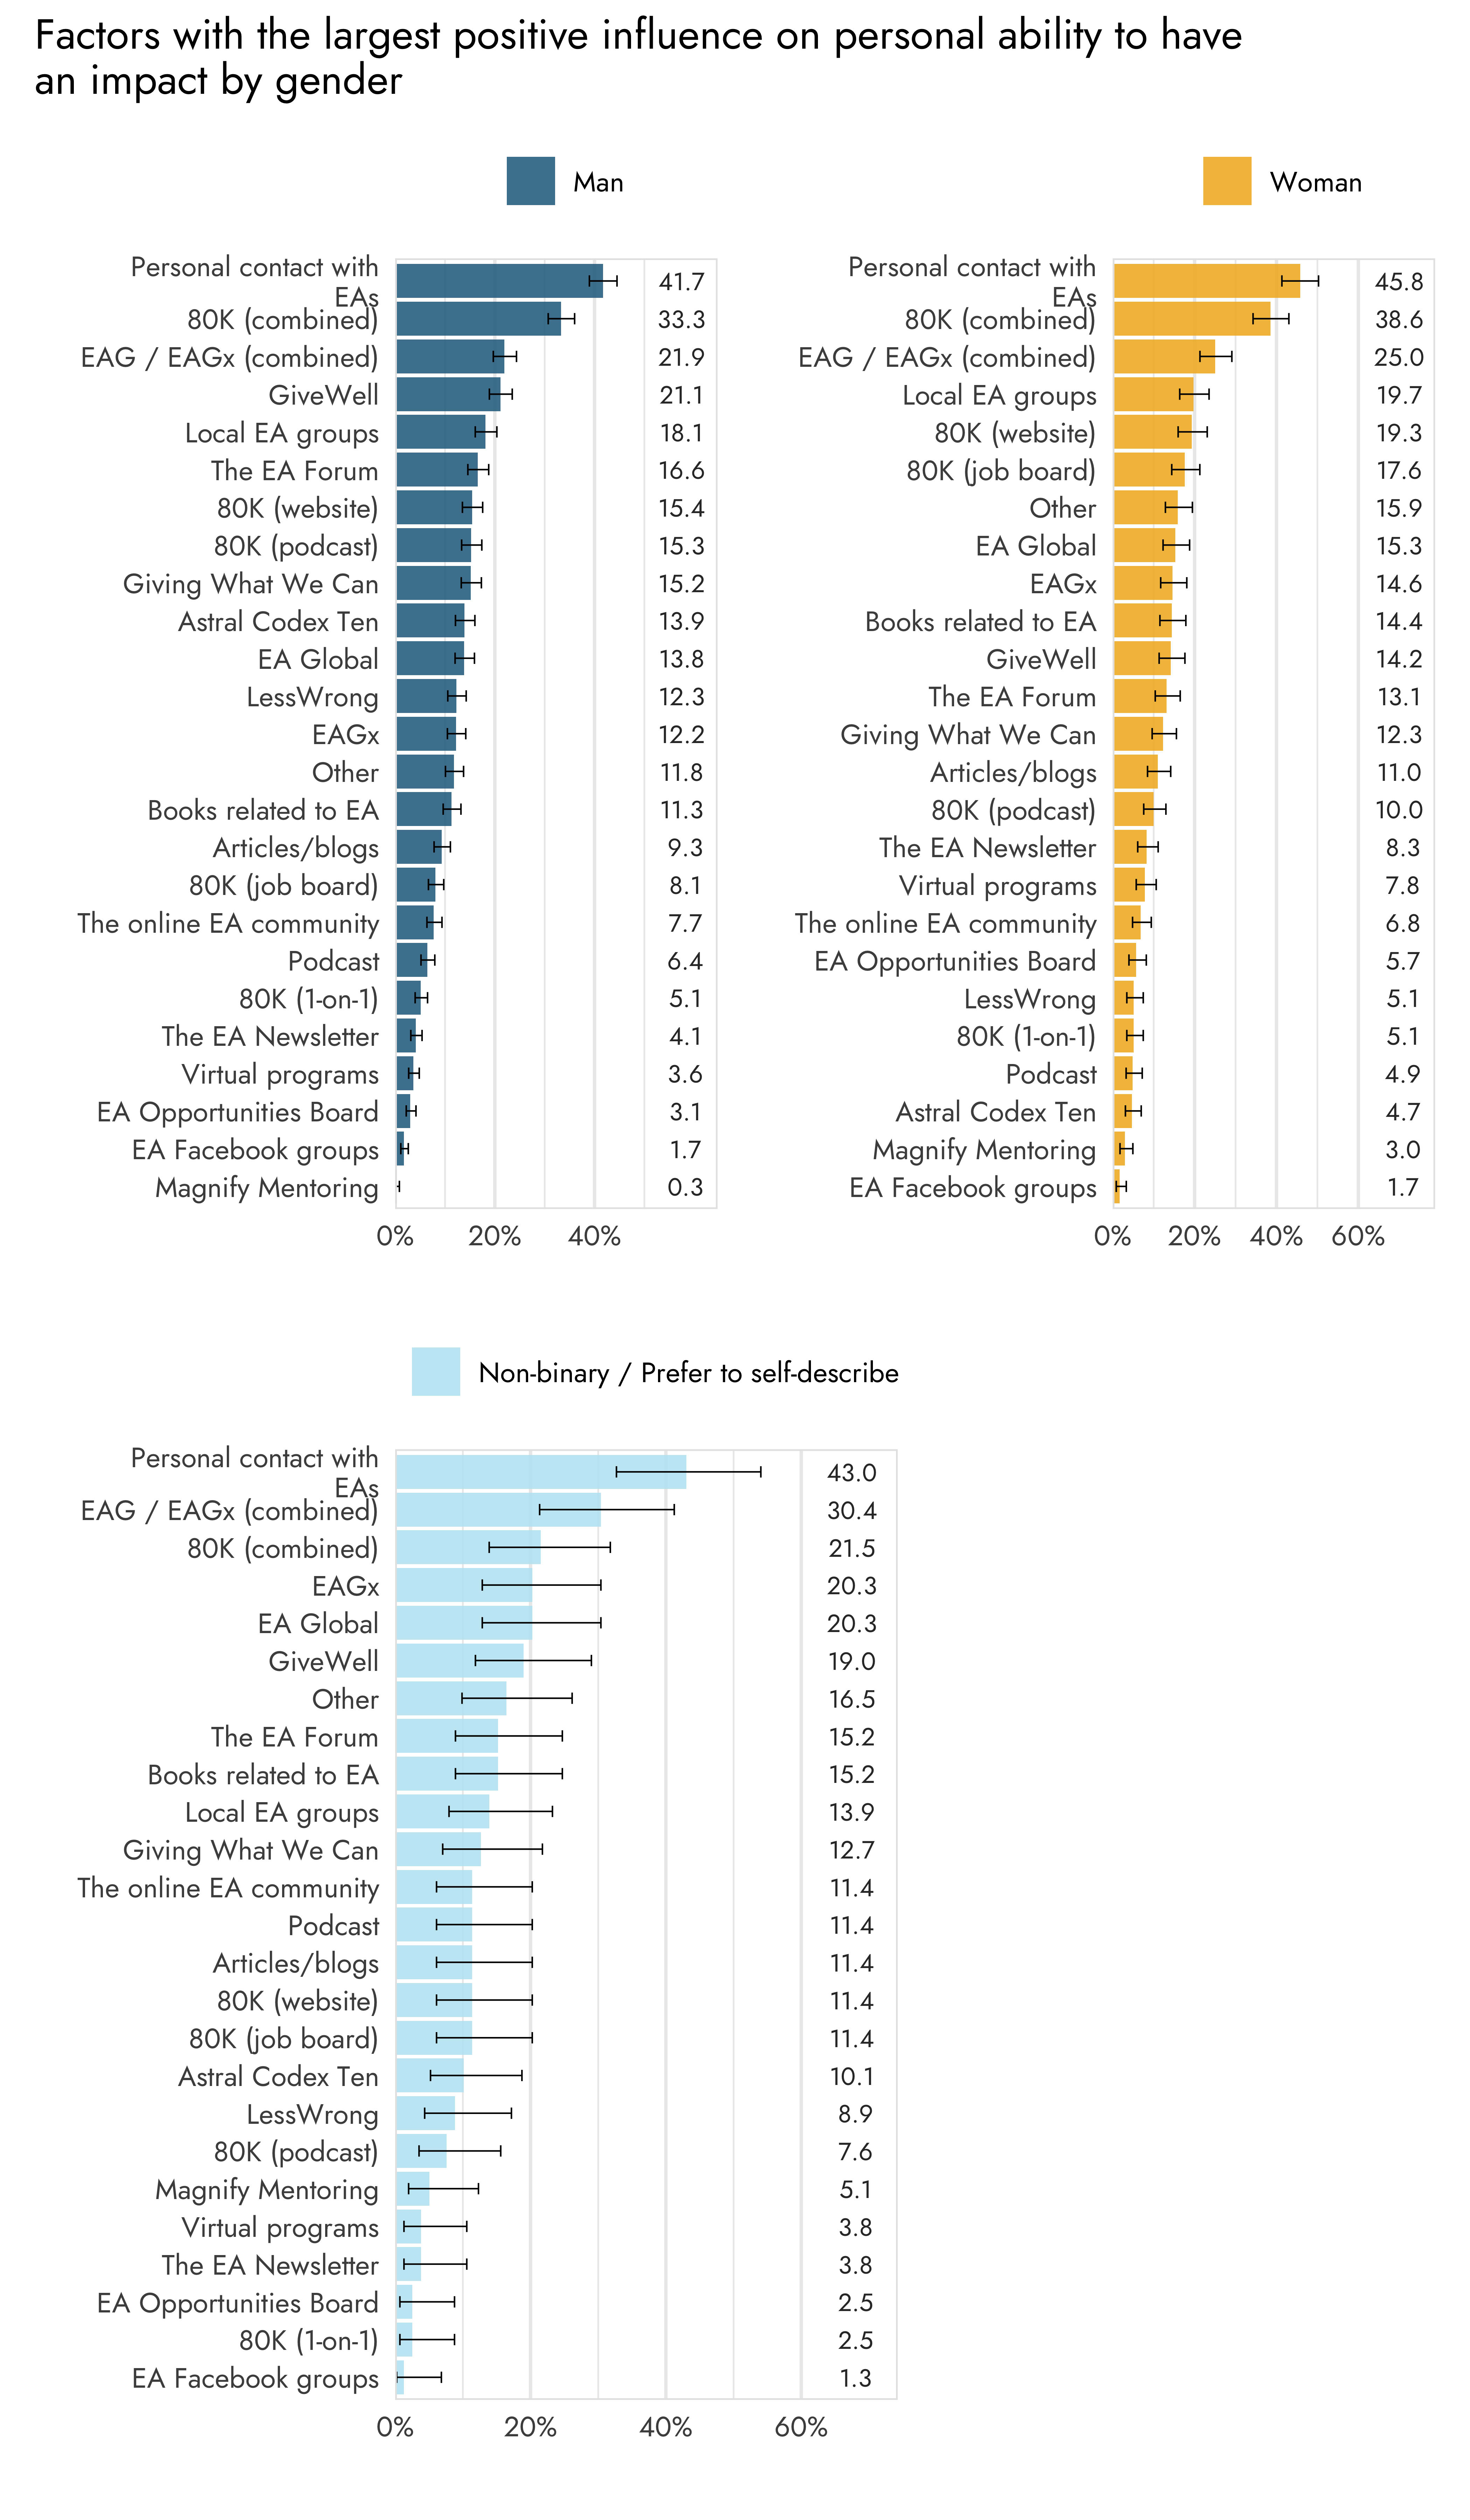
The top three most important factors are quite consistent across groups. However, beyond that, we see some notable differences. For example, GiveWell is the fourth most selected option for men (21.1%) but considerably lower for women (14.2%). Likewise, the 80,000 Hours job board is among the most commonly selected option for women (17.6%), but not for men (8.1%).
The differences between gender categories for specific factors can be more directly seen in the graph below.
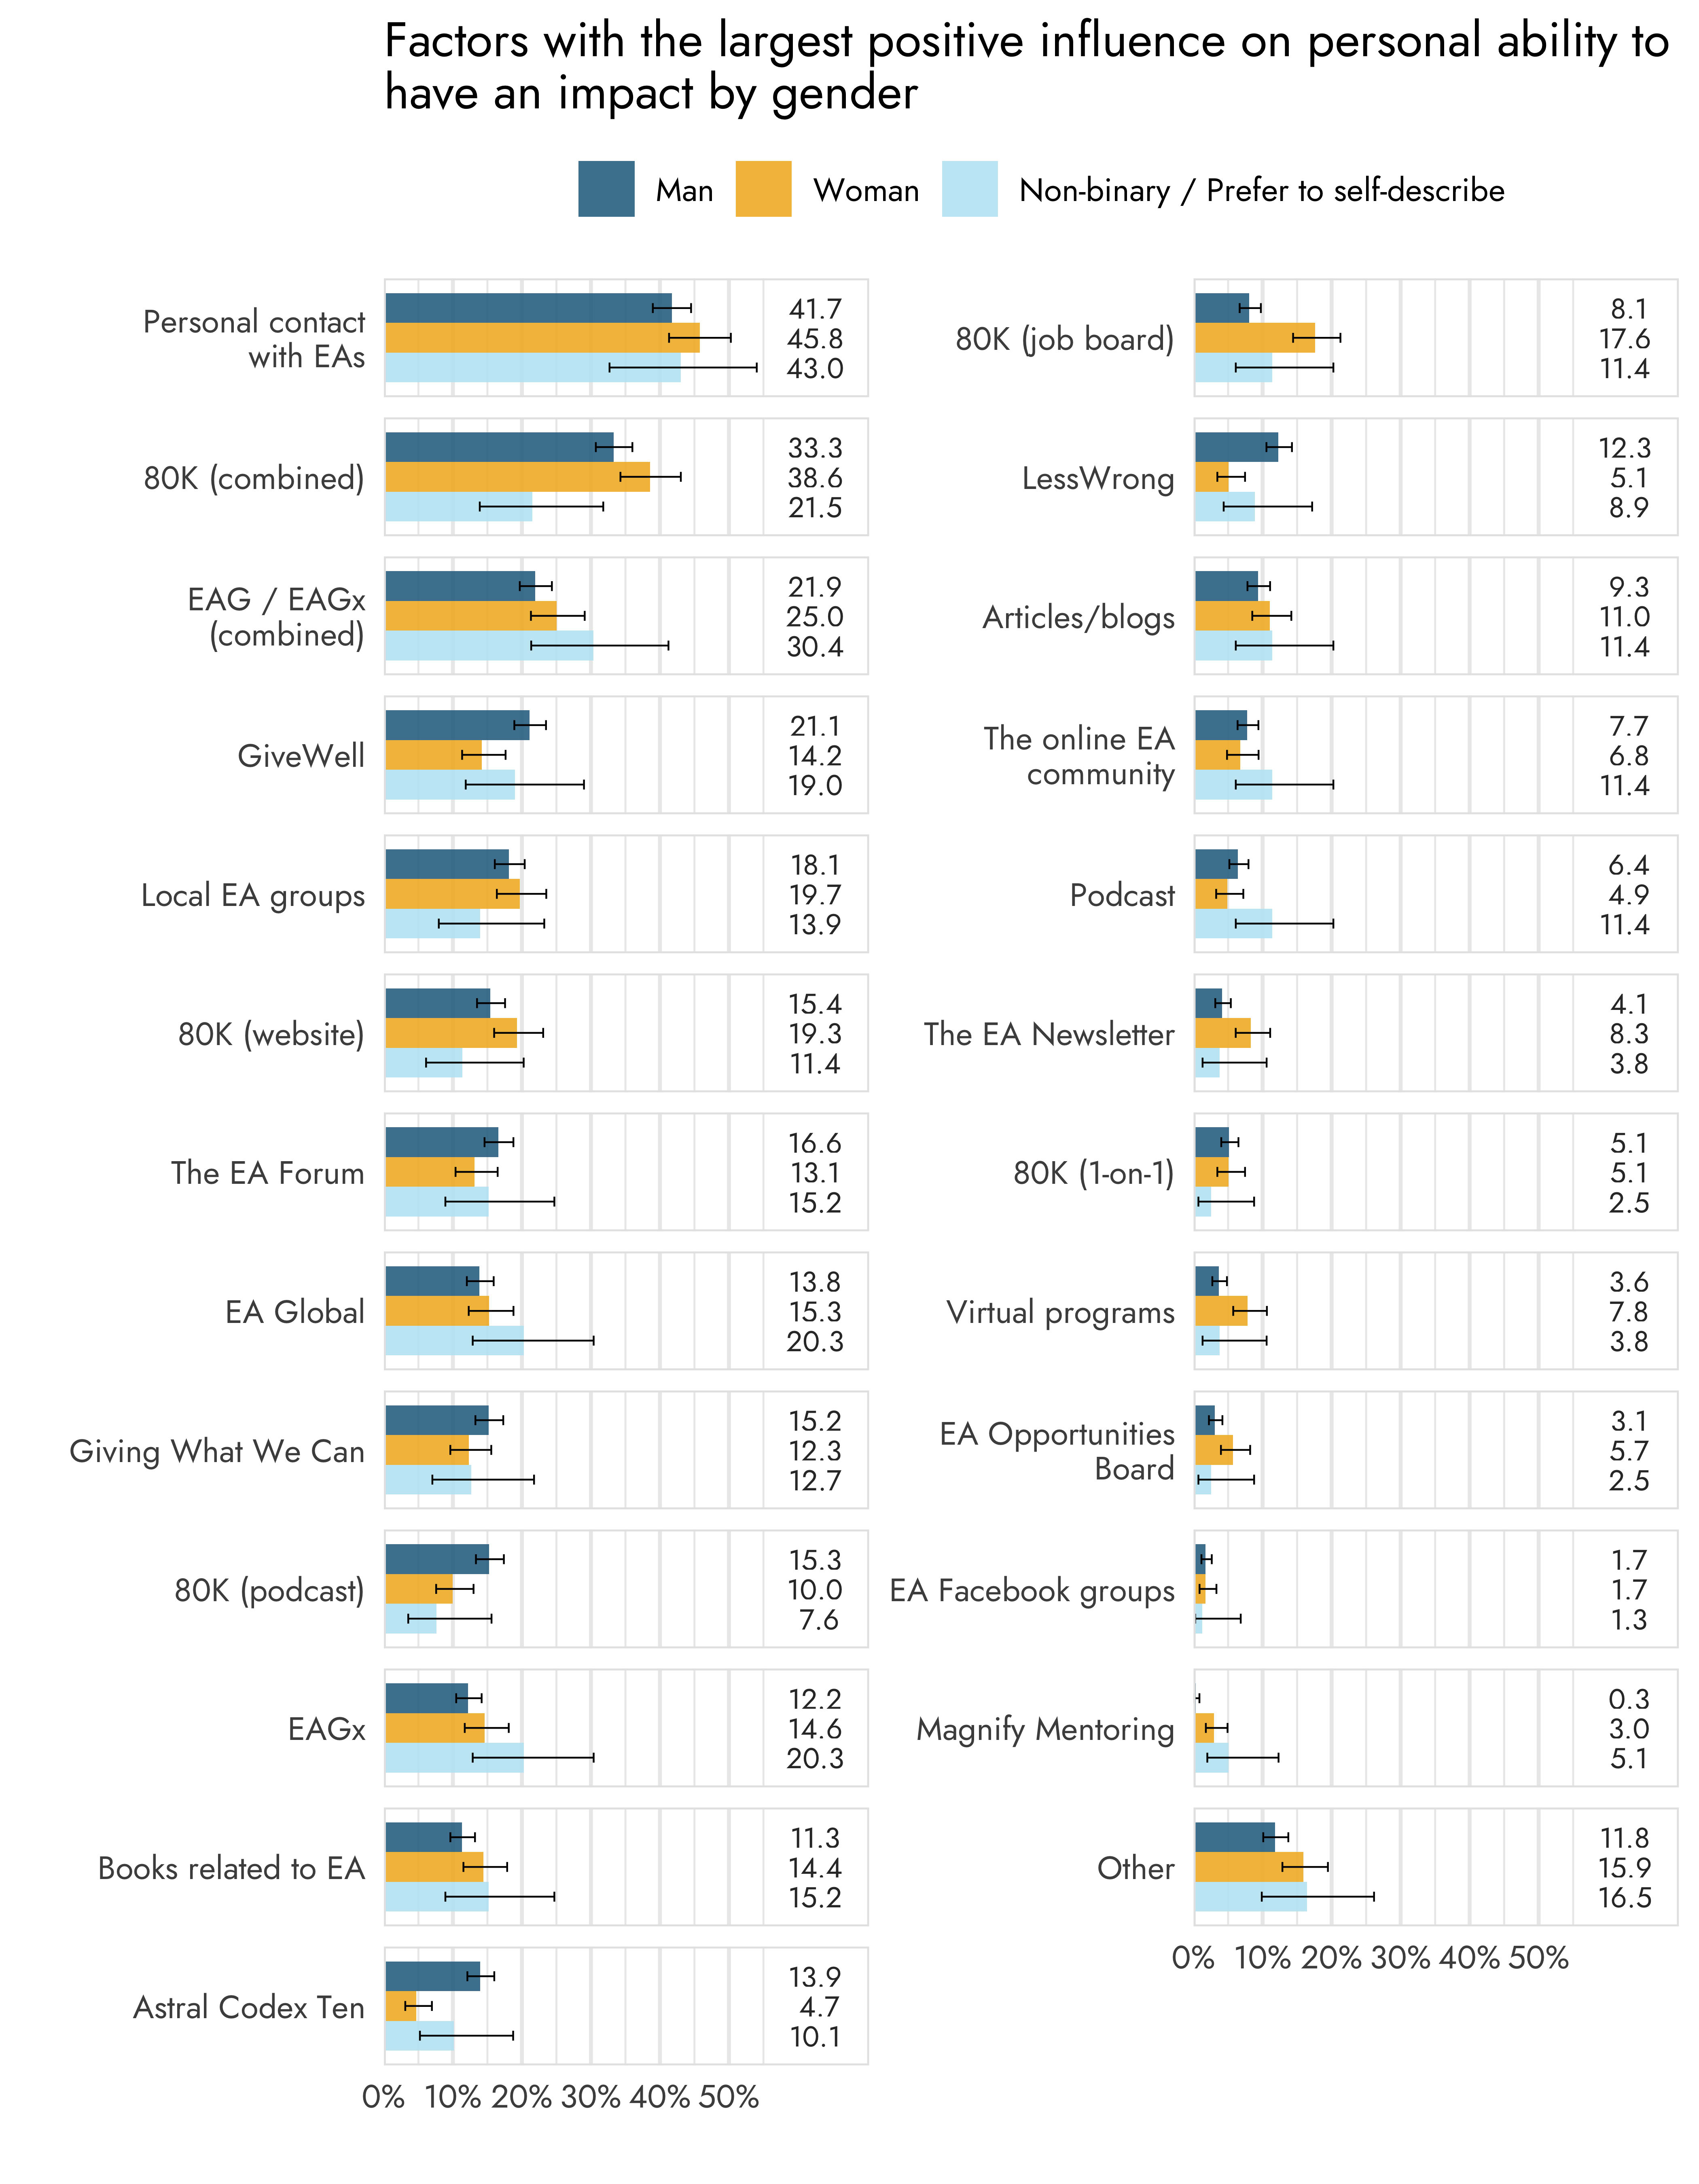
This highlights some additional differences. Women were more likely to select 80,000 Hours factors (combined; 38.6%) compared to both men (33.3%) and non-binary / respondents who preferred to self-describe (21.5%). These differences can be attributed to gender differences on specific factors related to 80,000 Hours. As noted, women were more likely to select the 80,000 Hours job board (17.6%) compared to men (8.1%) and more likely to select the website (19.3%) compared to non-binary / prefer to self-describe respondents (11.4%). Men, on the other hand, were more likely to select the 80,000 Hours podcast (15.3%) compared to women (10%) and non-binary / prefer to self-describe respondents (7.6%).
Compared to men, women were also more likely to select virtual programs (7.8% vs. 3.6%), the EA Newsletter (8.3% vs. 4.1%), other factors (15.9% vs. 11.8%), the EA Opportunities Board (5.7% vs. 3.1%), and Magnify Mentoring (3% vs. 0.3%).
Racial/ethnic identity
Several differences can be observed between respondents with a White racial/ethnic identity and respondents with a racial/ethnic identity other than White.
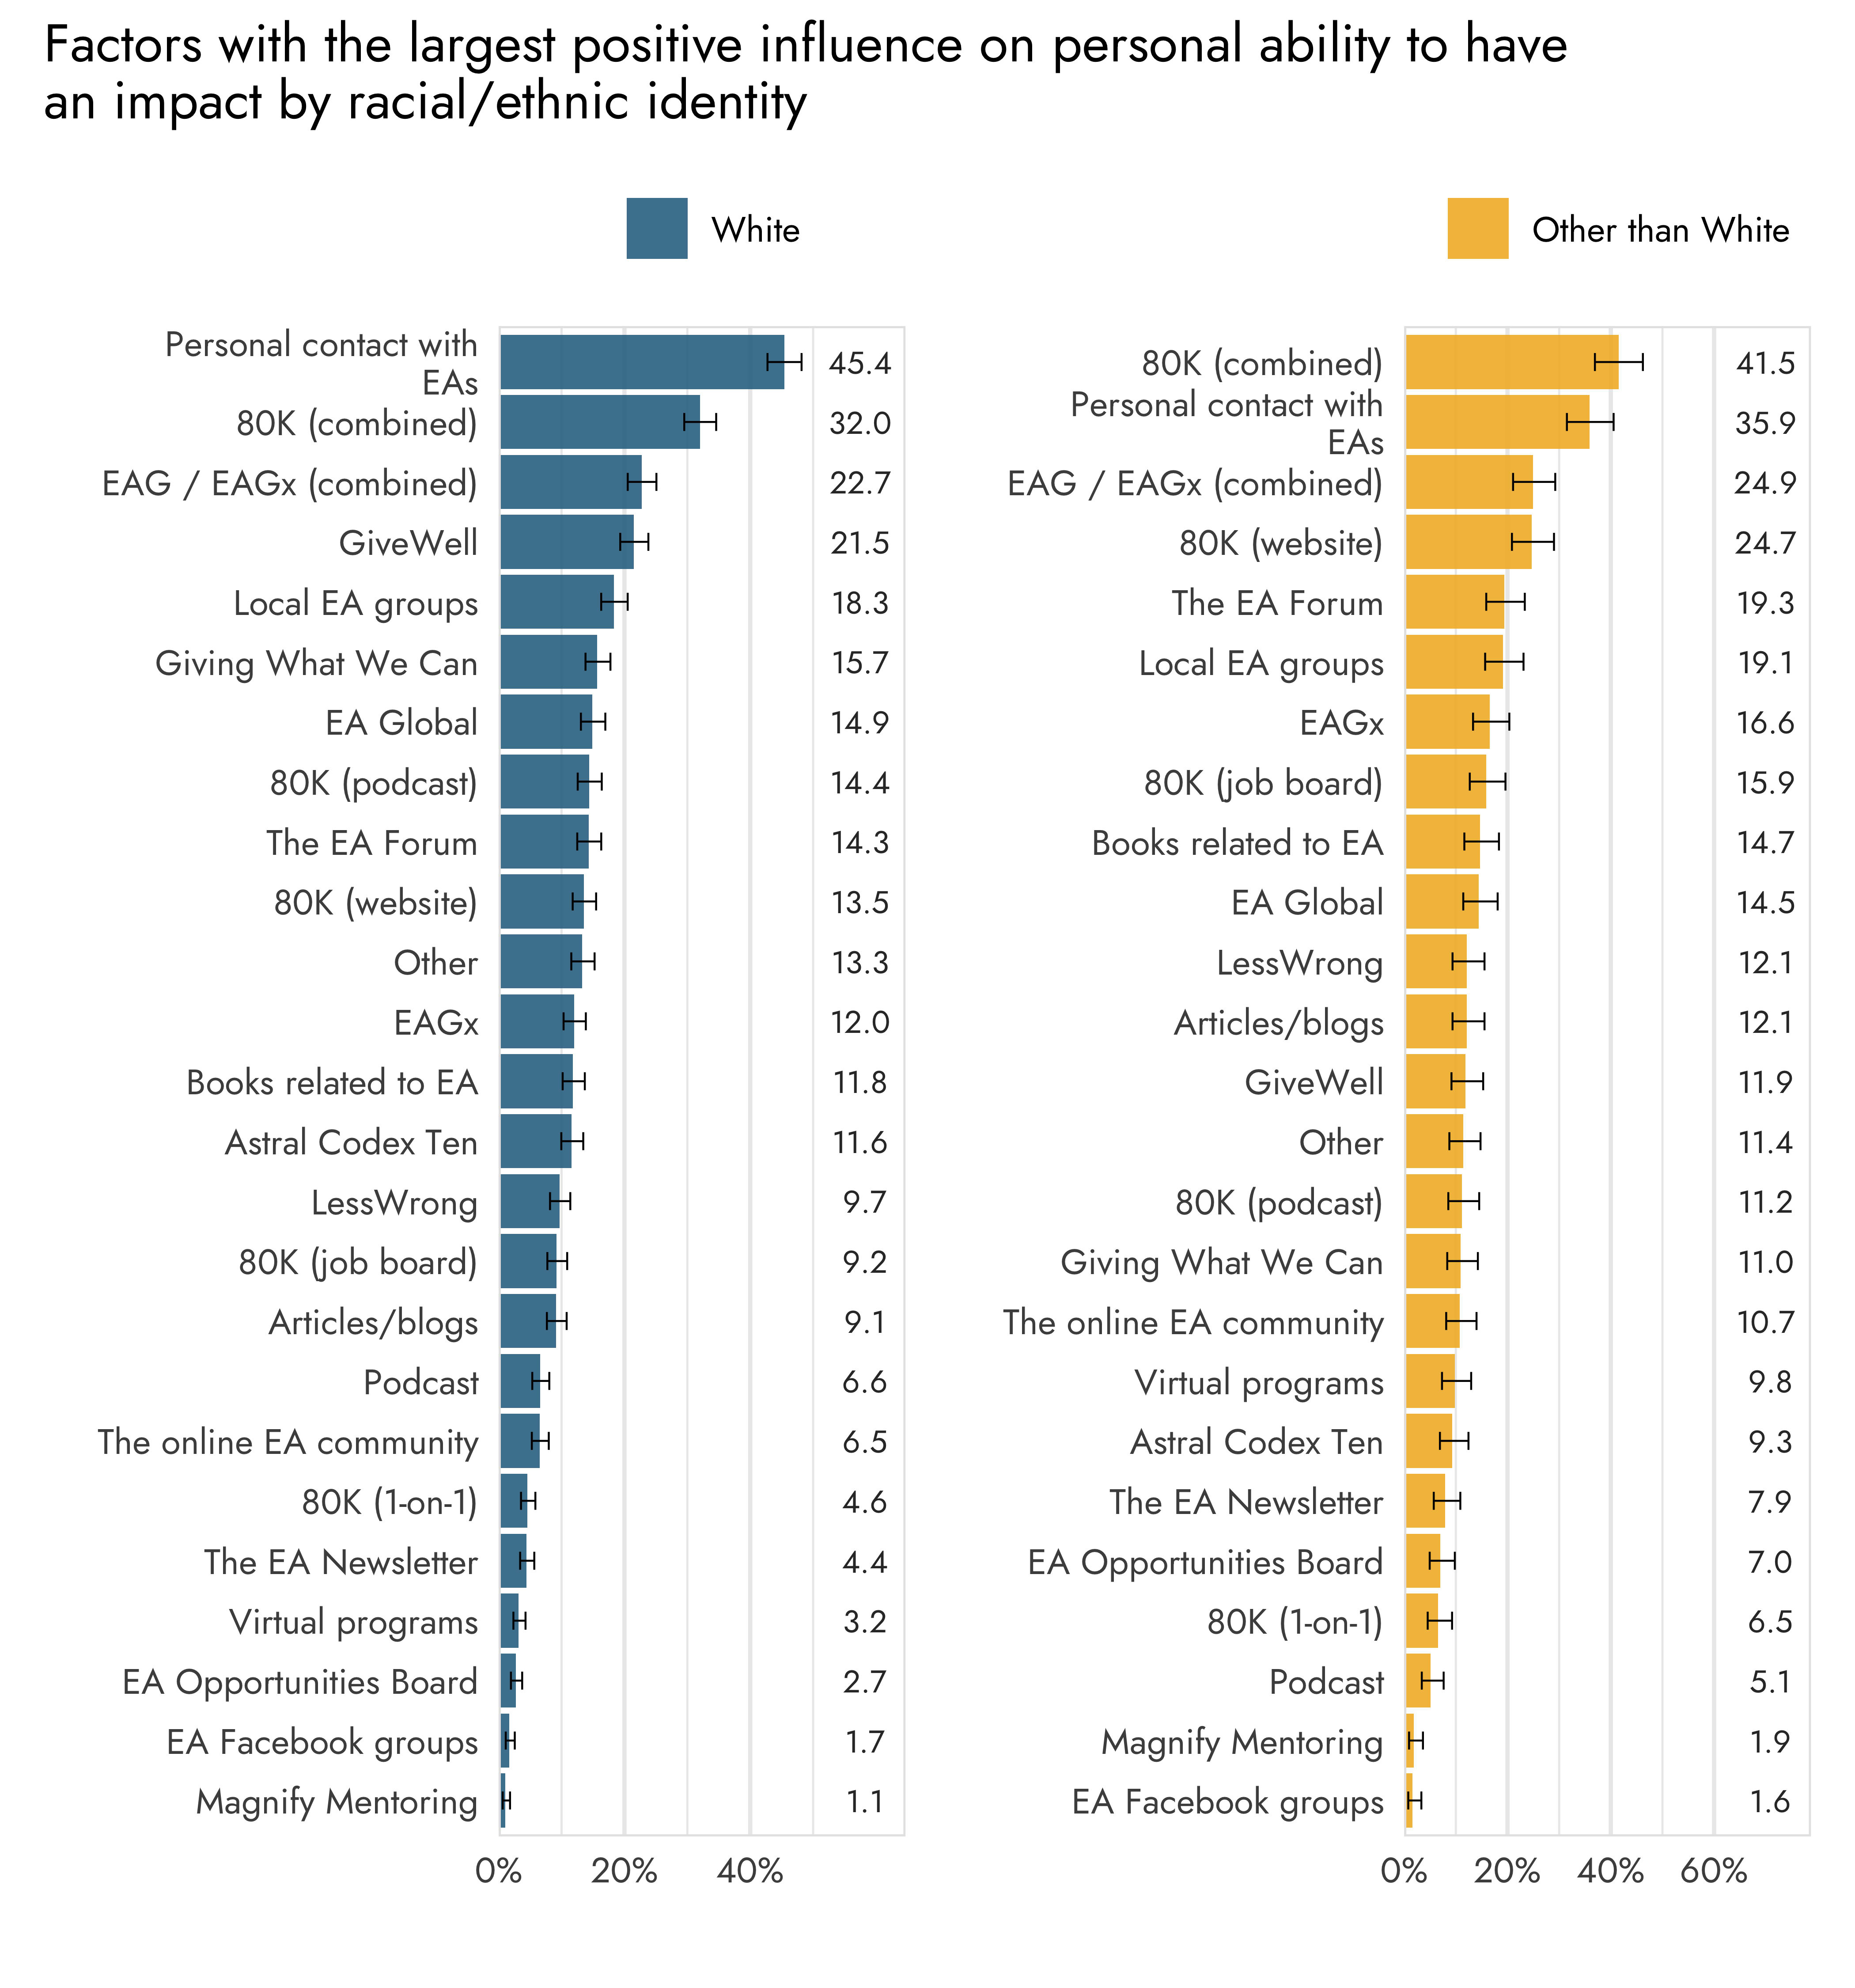
Here we also see that the same top three factors are the most important for both groups. However, for white respondents, personal contacts are most important (45.4% vs 35.9% for non-white respondents), while, for non-white respondents, 80,000 Hours (combined) is most important (41.5% vs 32.0% for white respondents).
We also see that, beyond the top 3 factors, GiveWell was much more commonly cited as important for white respondents (21.5%) than non-white (11.9%).
The similarities and differences in the ranking of the most important factors by racial/ethnic identity can also be seen in the graph below.
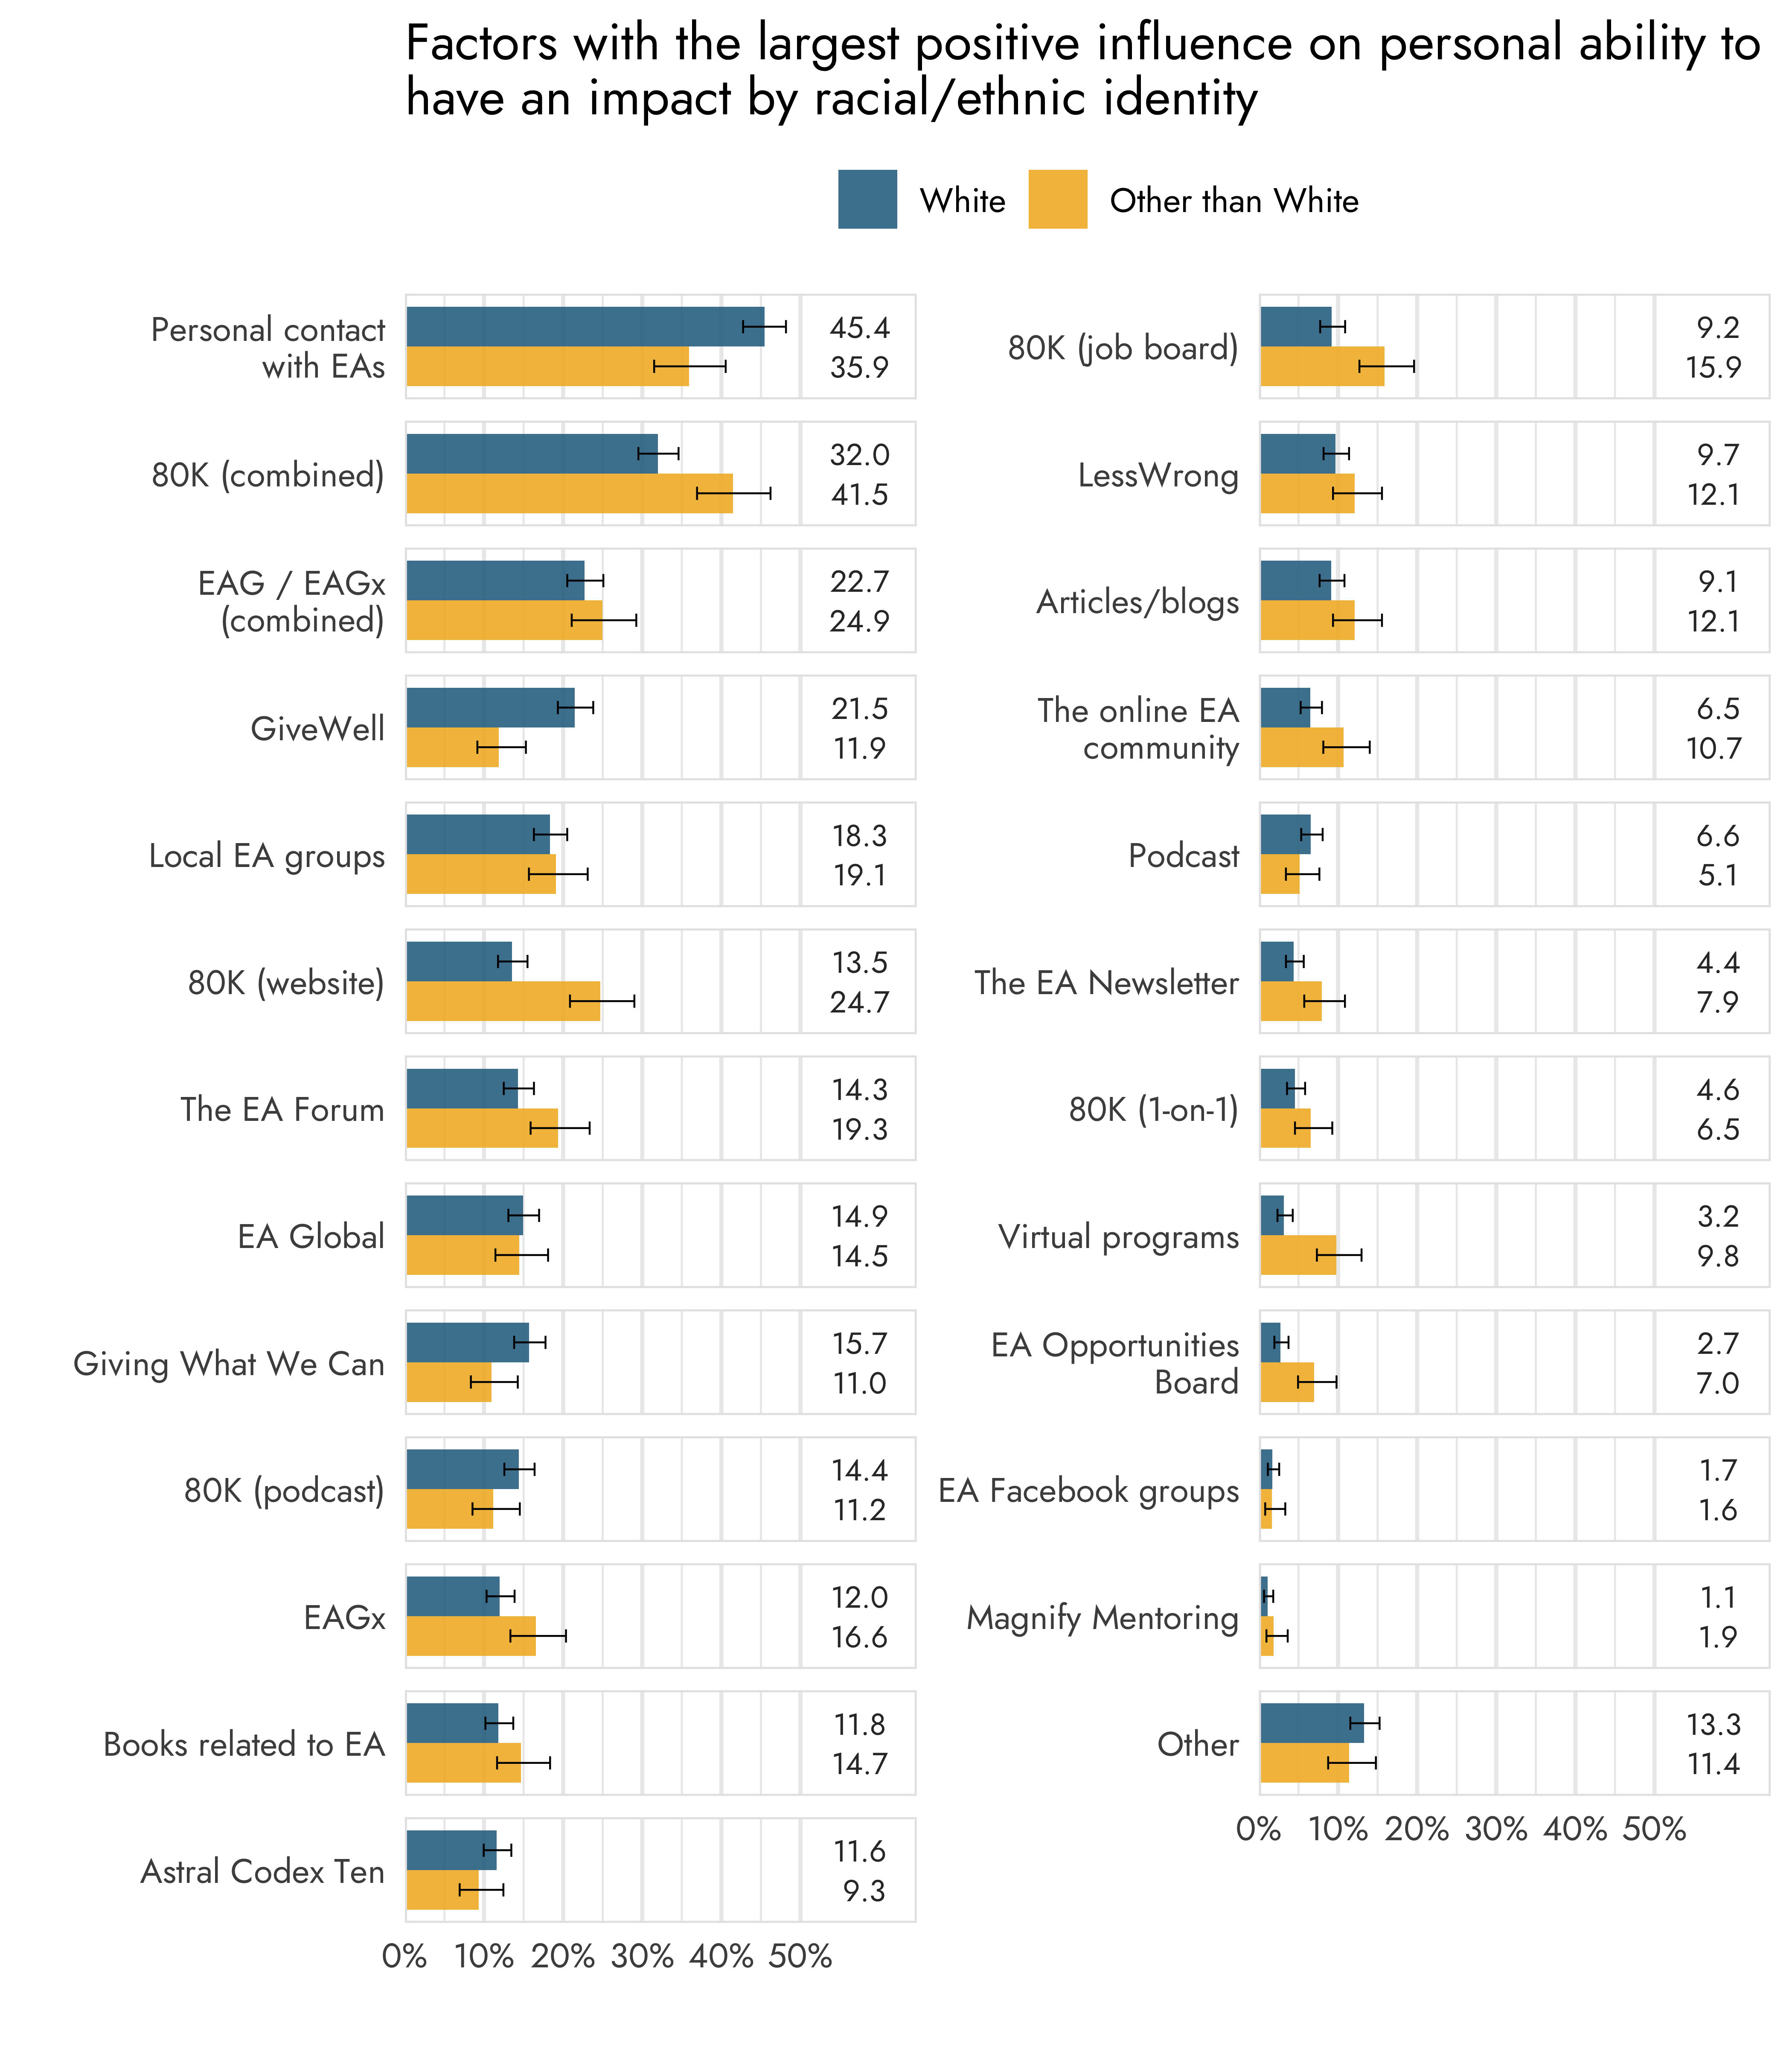
White respondents are more likely to have selected GiveWell (21.5% vs. 11.9%), personal contact with EAs (45.4% vs. 35.9%), and GWWC (15.7% vs. 11%).
Respondents without a White racial/ethnic identity were more likely to select 80,000 Hours (combined; 41.5% vs. 32%), which appears to be specifically due to differences in selecting the 80,000 Hours website (24.7% vs. 13.5%) and the job board (15.9% vs. 9.2%). These respondents were also more likely to pick virtual programs (9.8% vs. 3.2%), the EA Forum (19.3% vs. 14.3%), EAGx (16.6% vs. 12%), EA Opportunities Board (7% vs. 2.7%), the online EA Community (10.7% and 6.5%), and the EA newsletter (7.9% vs. 4.4%).
Engagement
Multiple differences were found between respondents who report having a low engagement in EA or high engagement, including several sizable differences. As we noted last time, some of the engagement categories[3] that were used to distinguish between low and highly EA engaged respondents include specific references to sources that were also in the list of potential positive influence sources (e.g. the 80,000 Hours podcast, EAGs), which should be kept in mind when interpreting some of the differences.
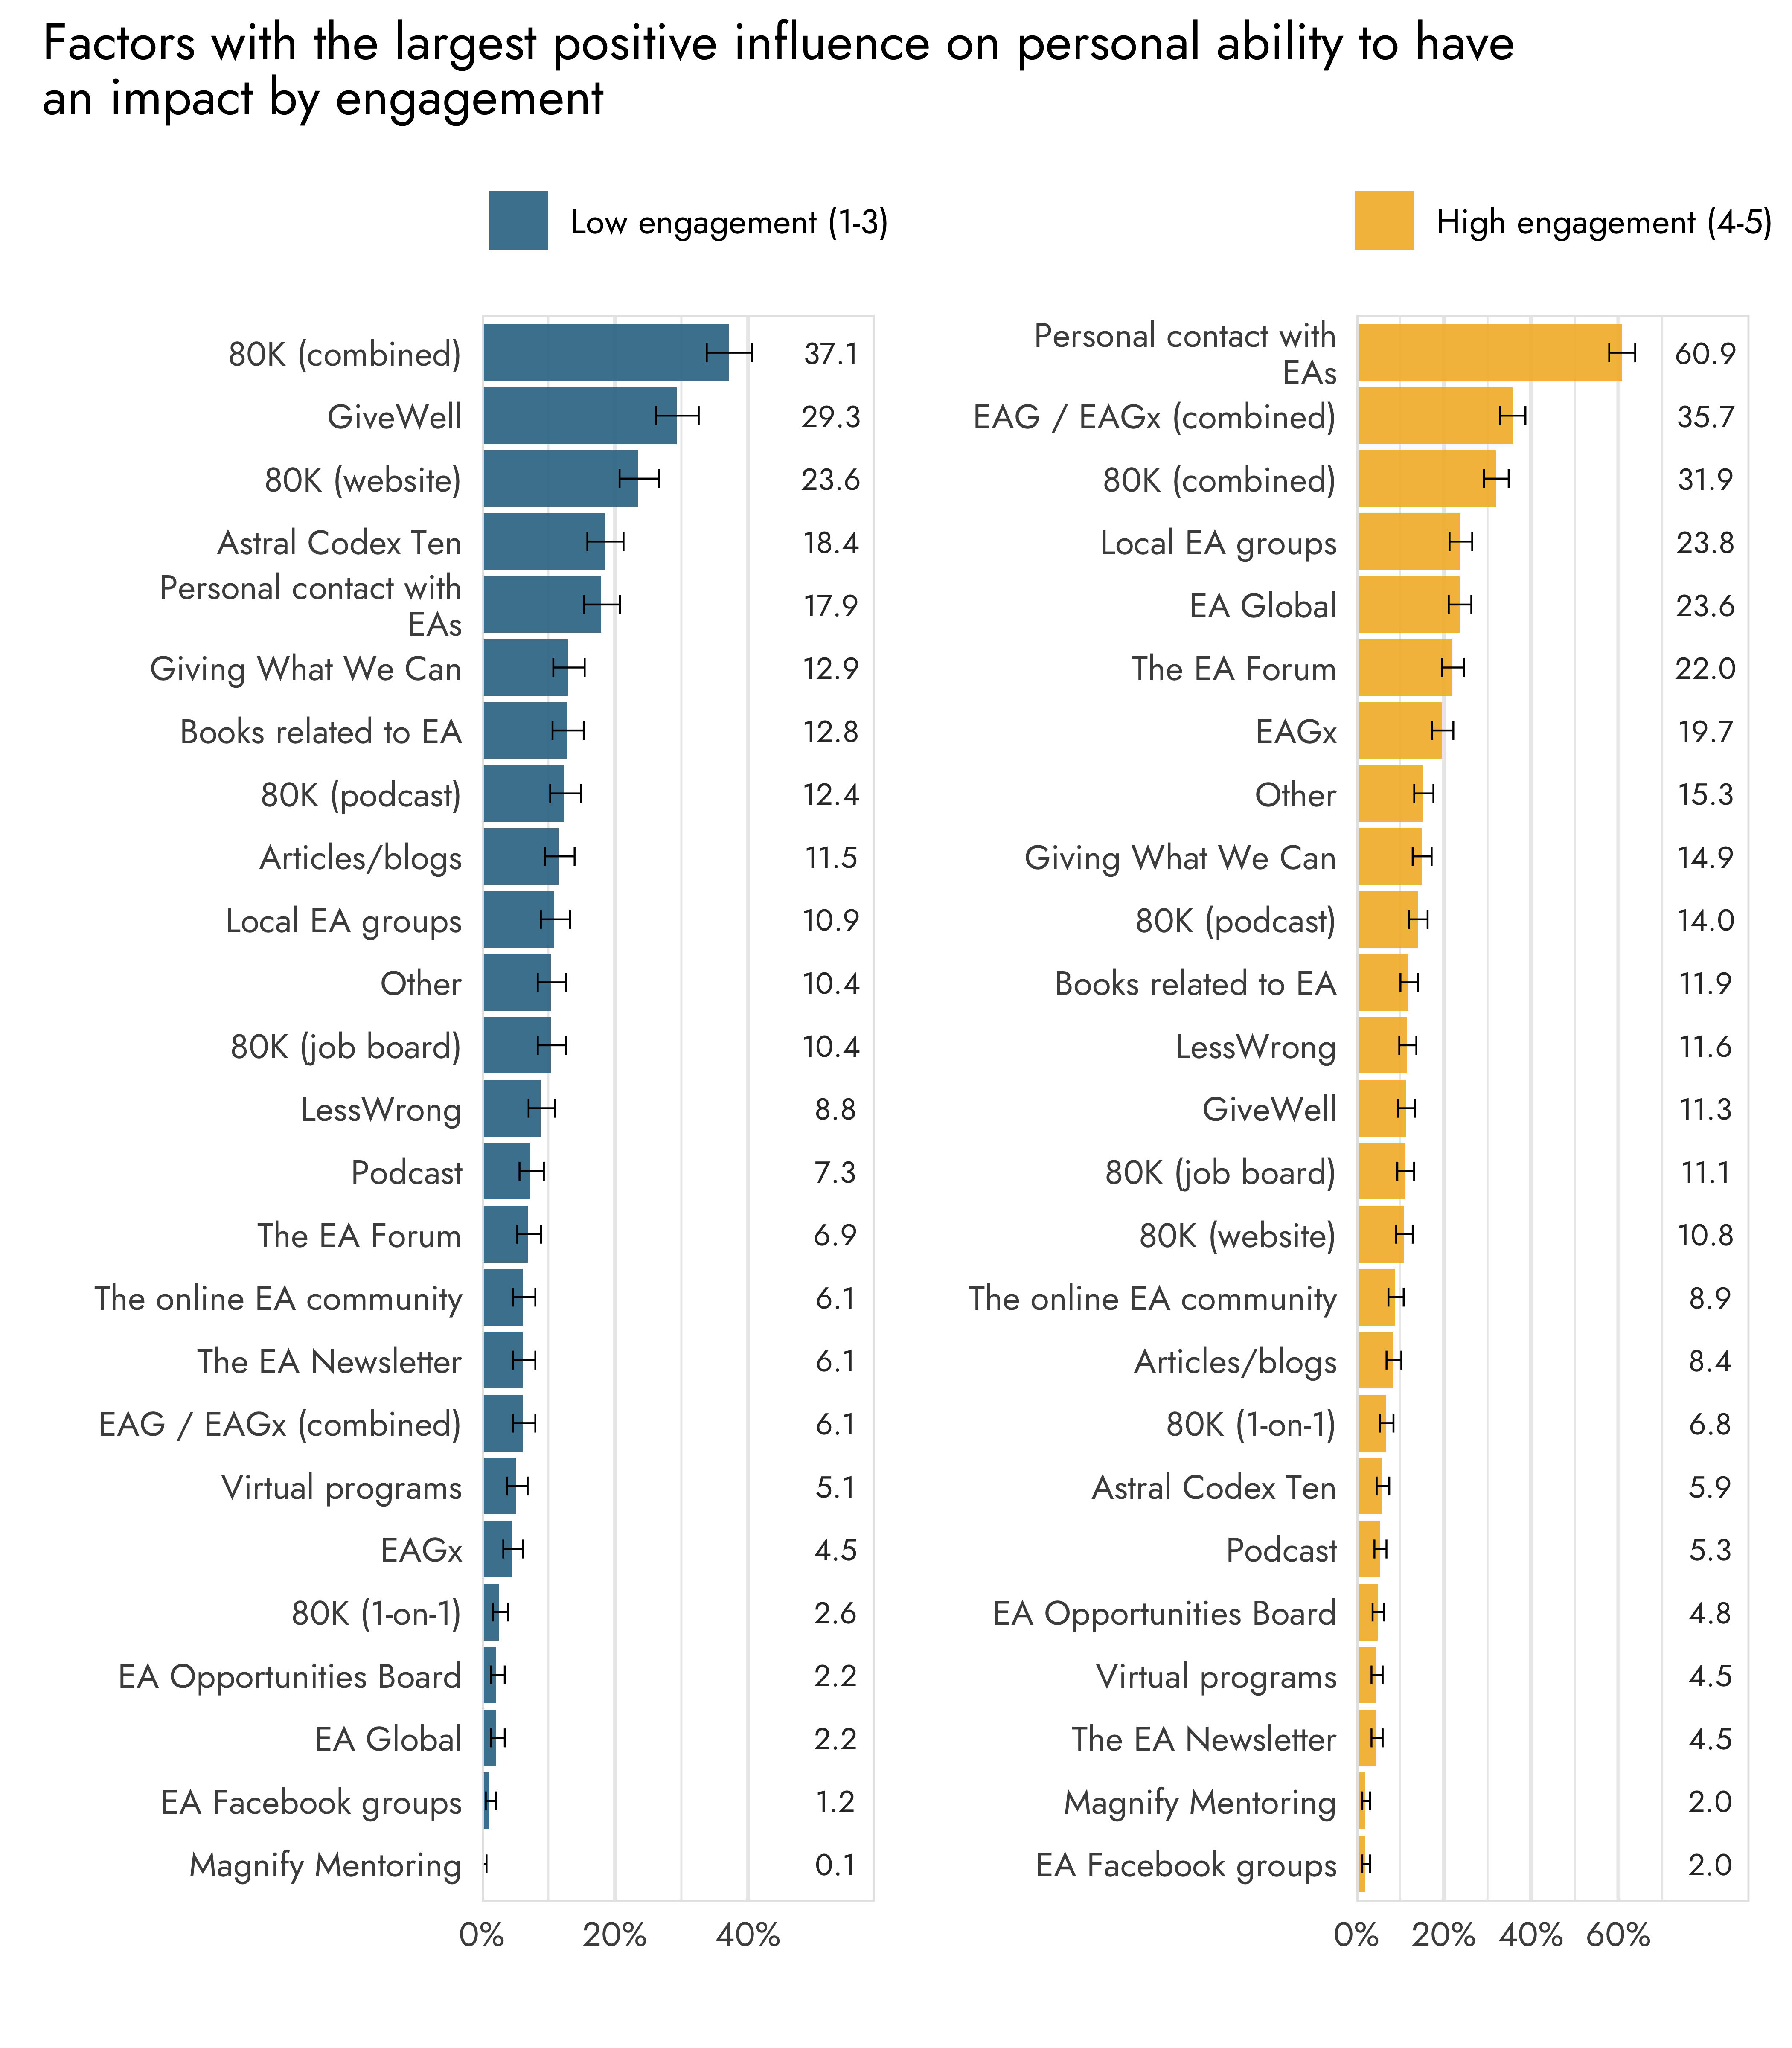
The most important factor for less engaged respondents is 80,000 Hours (combined), followed by GiveWell and the 80,000 Hours website. For highly engaged respondents, the most important factor, by far, is the personal contact with EAs, followed by 80,000 Hours (combined) and local EA groups. EAG, EAGx and the EA Forum, were also substantially more important for highly engaged respondents.
The differences between low and highly engaged respondents, for each factor, can be seen in the graph below.
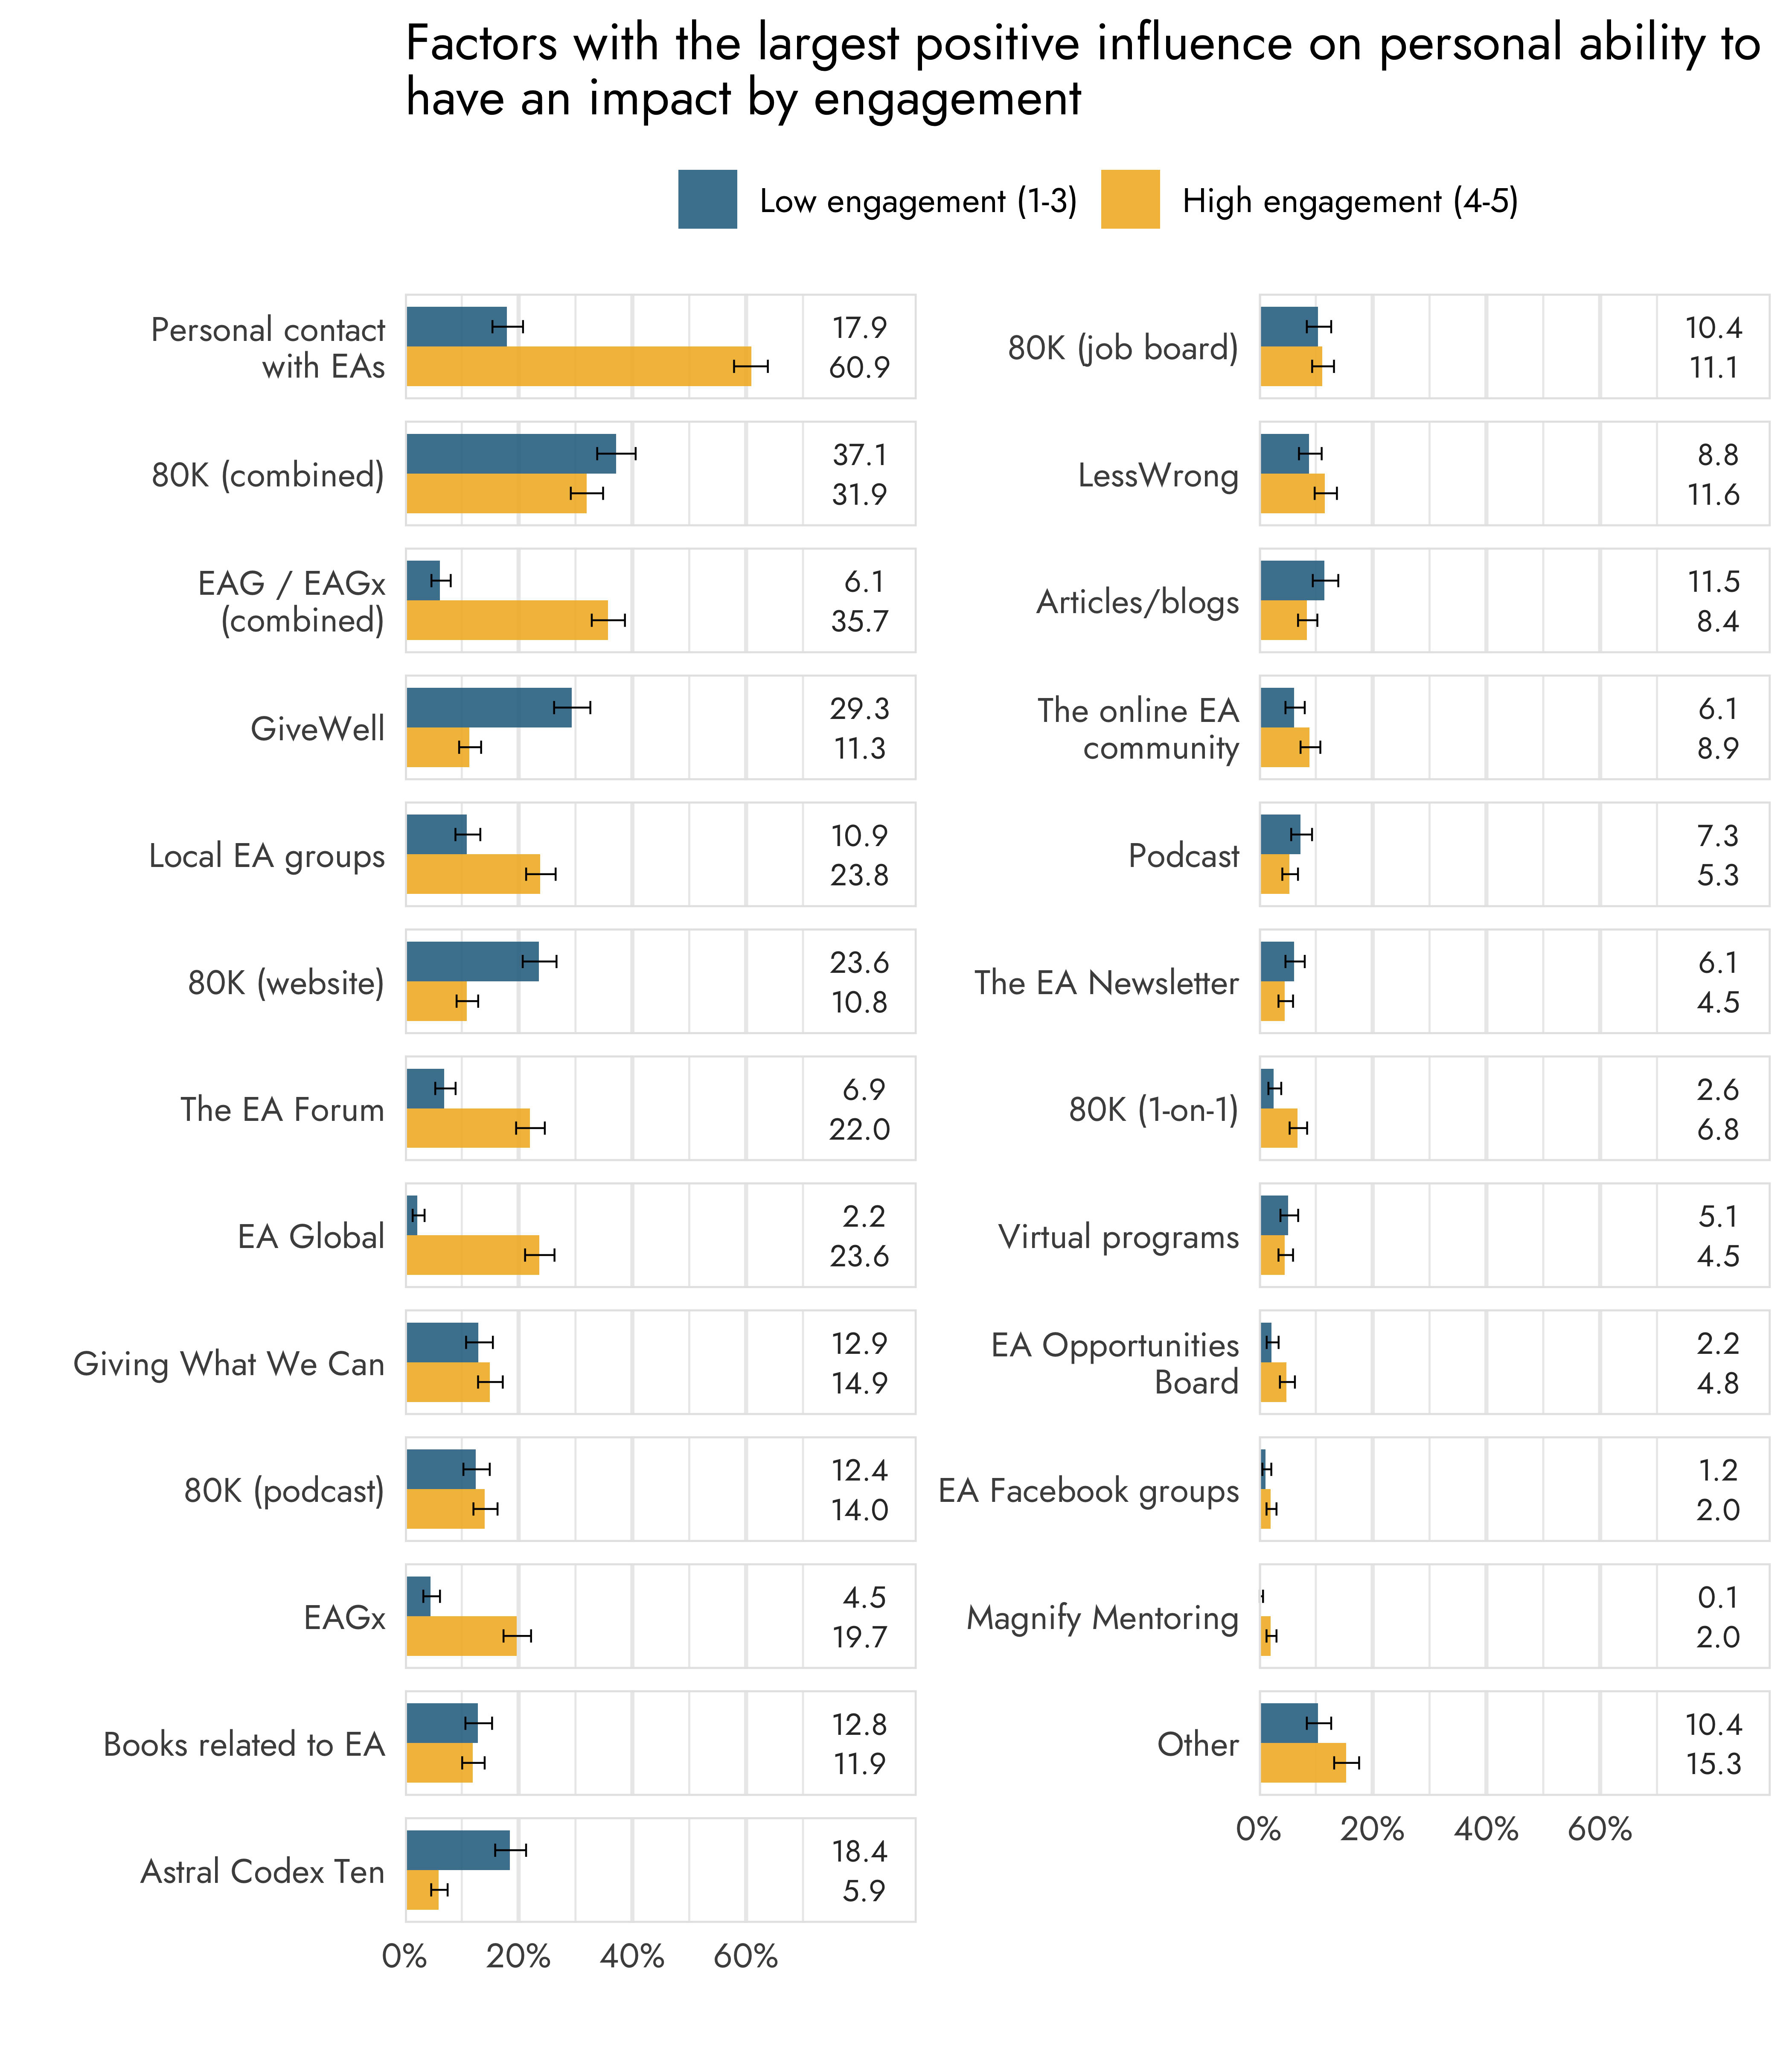
Respondents high in EA engagement were more likely to select personal contact with EAs (60.9% vs. 17.9%), EA Global (23.6% vs. 2.2%), EAGx (19.7% vs. 4.5%), the EA Forum (22% vs 6.9%), local EA groups (23.8% vs. 10.9%), one-on-one career discussions with 80,000 Hours (6.8% vs. 2.6%), the online EA community (8.9% vs. 6.1%), EA Opportunities Board (4.8% vs. 2.2%), and WANBAM / Magnify Mentoring (2% vs. 0.1%). They were also more likely to select the ‘Other’ category (15.3% vs. 10.4%).
On the other hand, respondents low in EA engagement were more likely to select GiveWell (29.3% vs. 11.3%), the 80,000 Hours website (23.6% vs. 10.8%), Astral Codex Ten (18.4% vs. 5.9%), 80,000 Hours (combined; 37.1% vs. 31.9%), and articles/blogs related to EA (11.5% vs. 8.4%).
New Connections
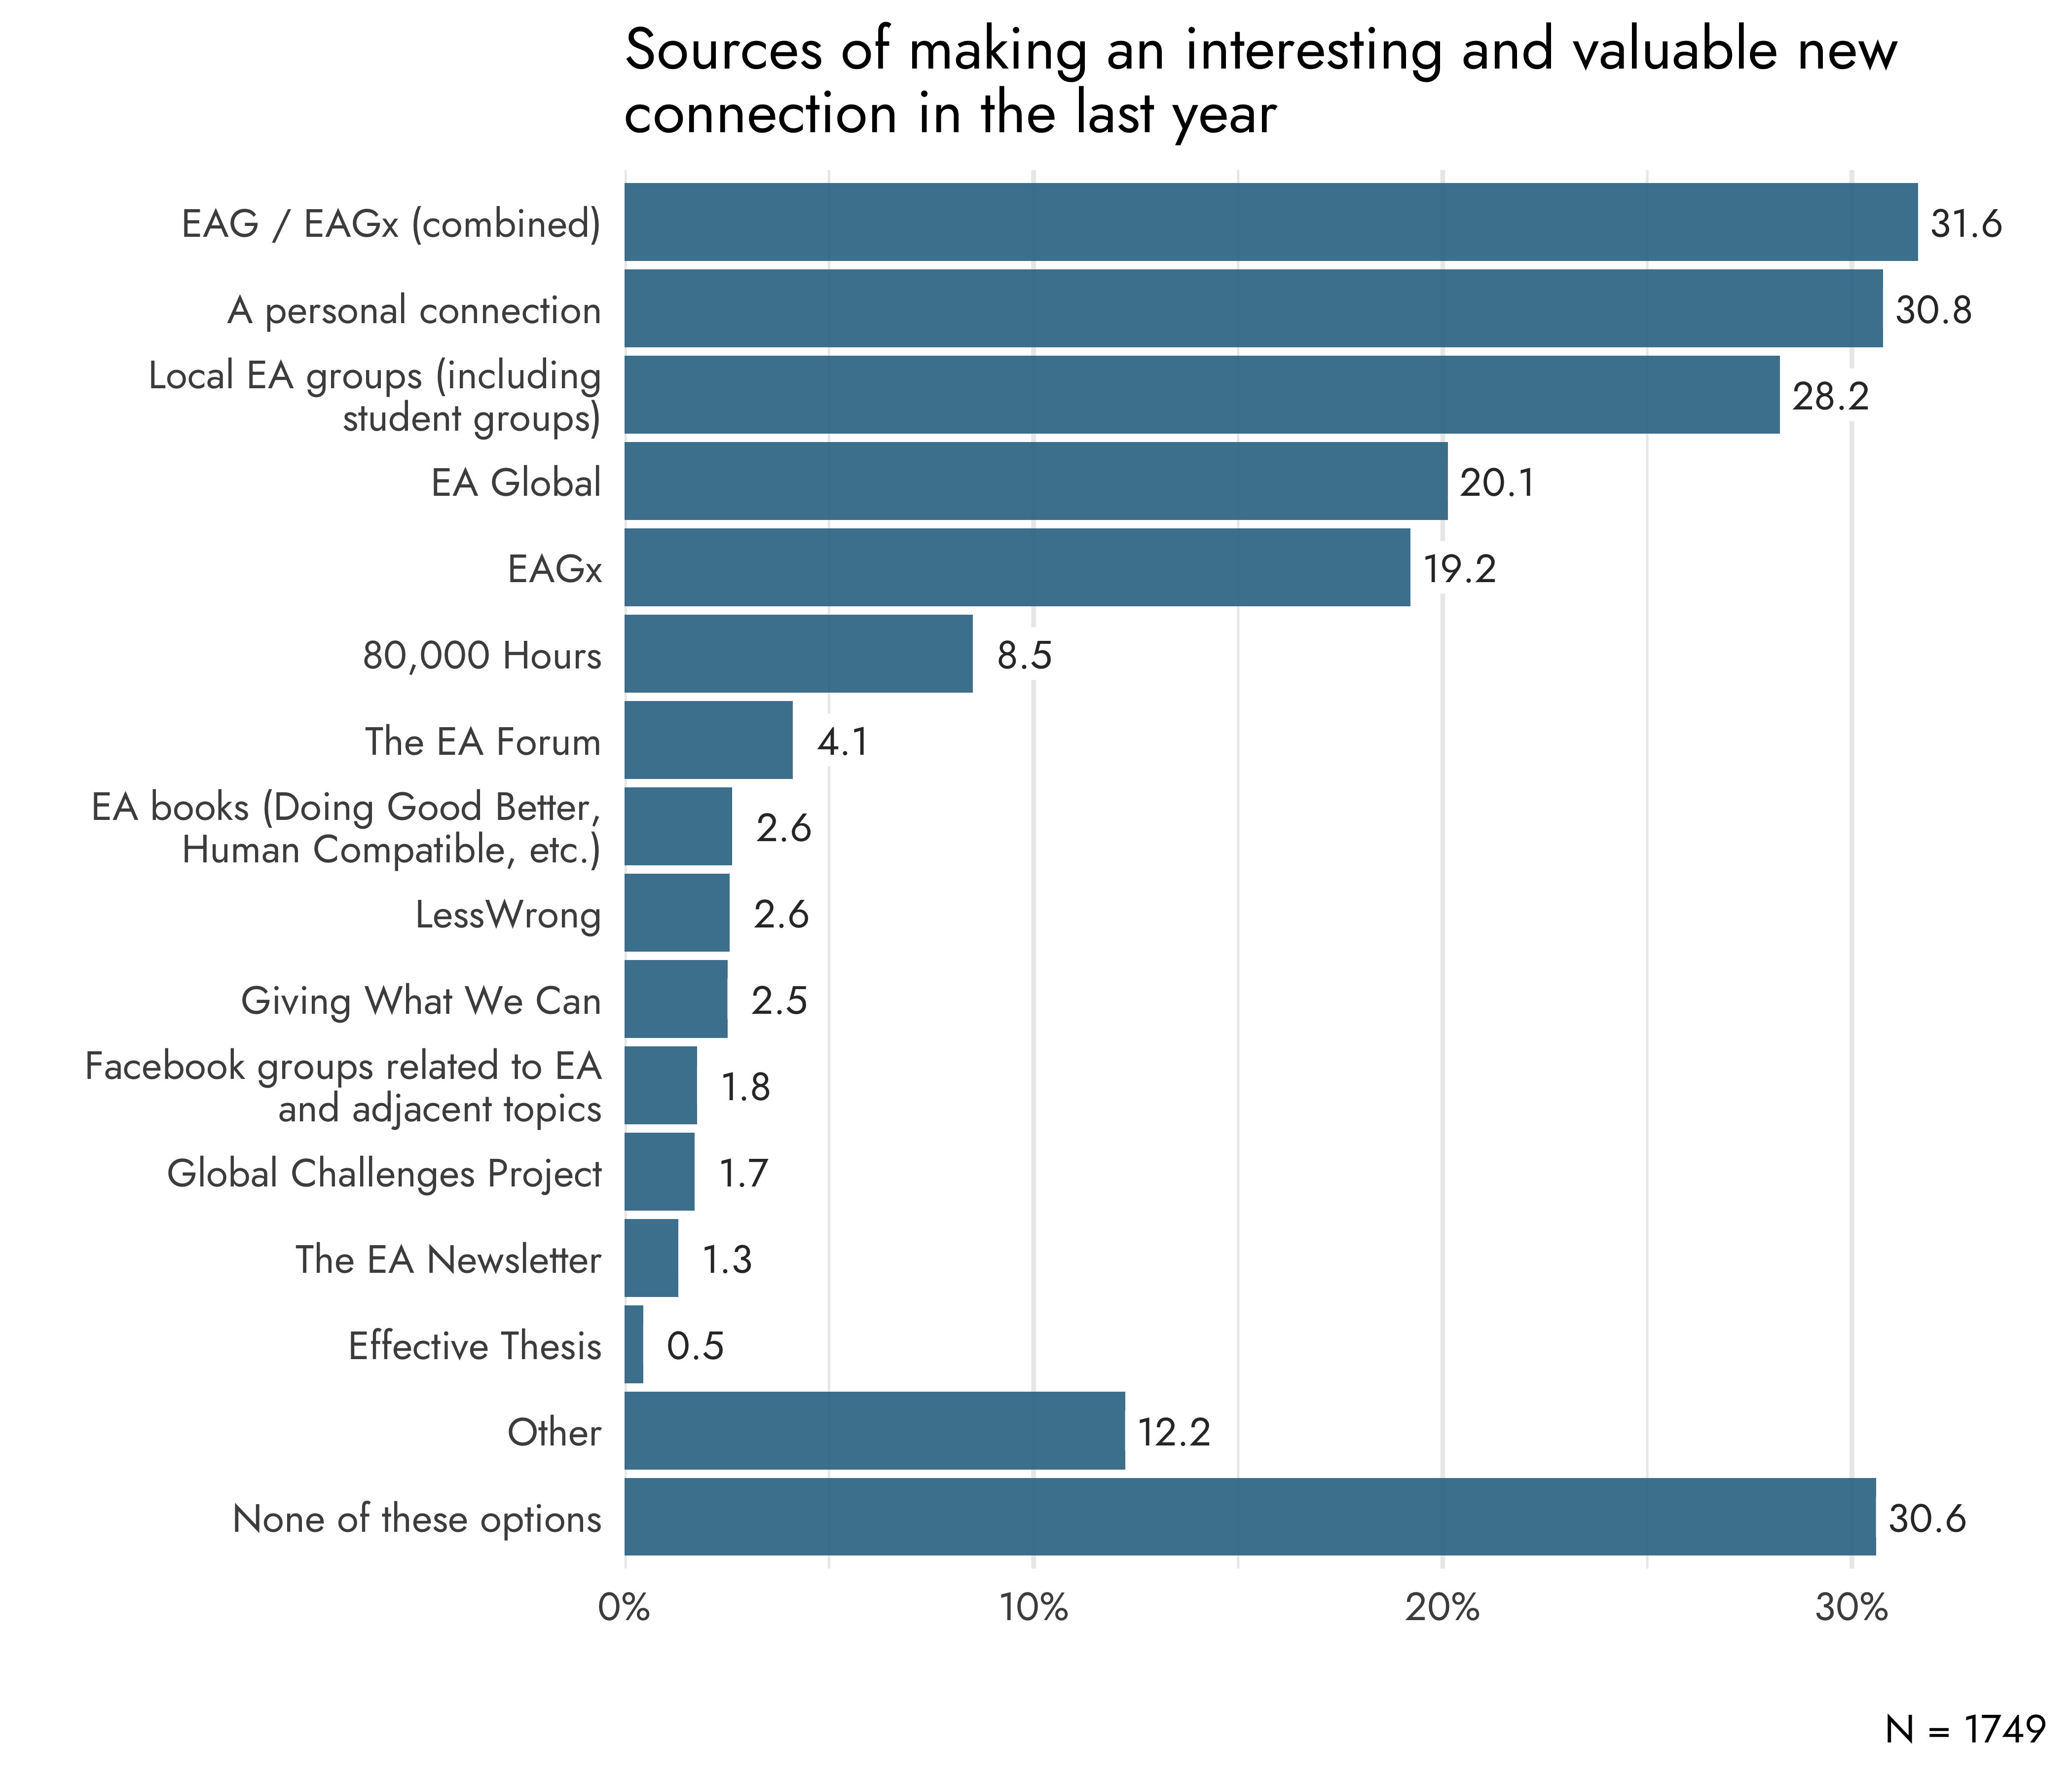
Respondents were presented with a list of options and were asked which were sources of them making an interesting and valuable new personal connection in the last year, including ‘Other’ and ‘None of these options’. They could select any number of options and on average selected 1.67 options with a median and mode of 1.
The most commonly selected option was a combination category consisting of EA Global and EAGx, selected by 31.6% of respondents who selected at least one option. Another option was ‘a personal connection’, which reflects that connections could themselves be sources of making a valuable new connection. This option was selected by 30.8% of respondents and was followed by local EA groups (28.2%), and the separate EA Global (20.1%) and EAGx options (19.2%).
This suggests that, perhaps unsurprisingly, the main drivers of individuals making new personal connections are cases where they come into direct personal contact with others.
Almost a third of the respondents (30.6%) selected ‘None of these options’.
This question was first asked in the 2020 EA Survey, although the question then was combined together with a question about whether or not various sources led the respondent to have changed their mind or to have learned something important regarding their path to impact.
As in the section about positive influences, we’ll focus on comparing the results of 2024 with 2022, as comparisons between 2020 and 2022 were already made in the previous post on this topic.
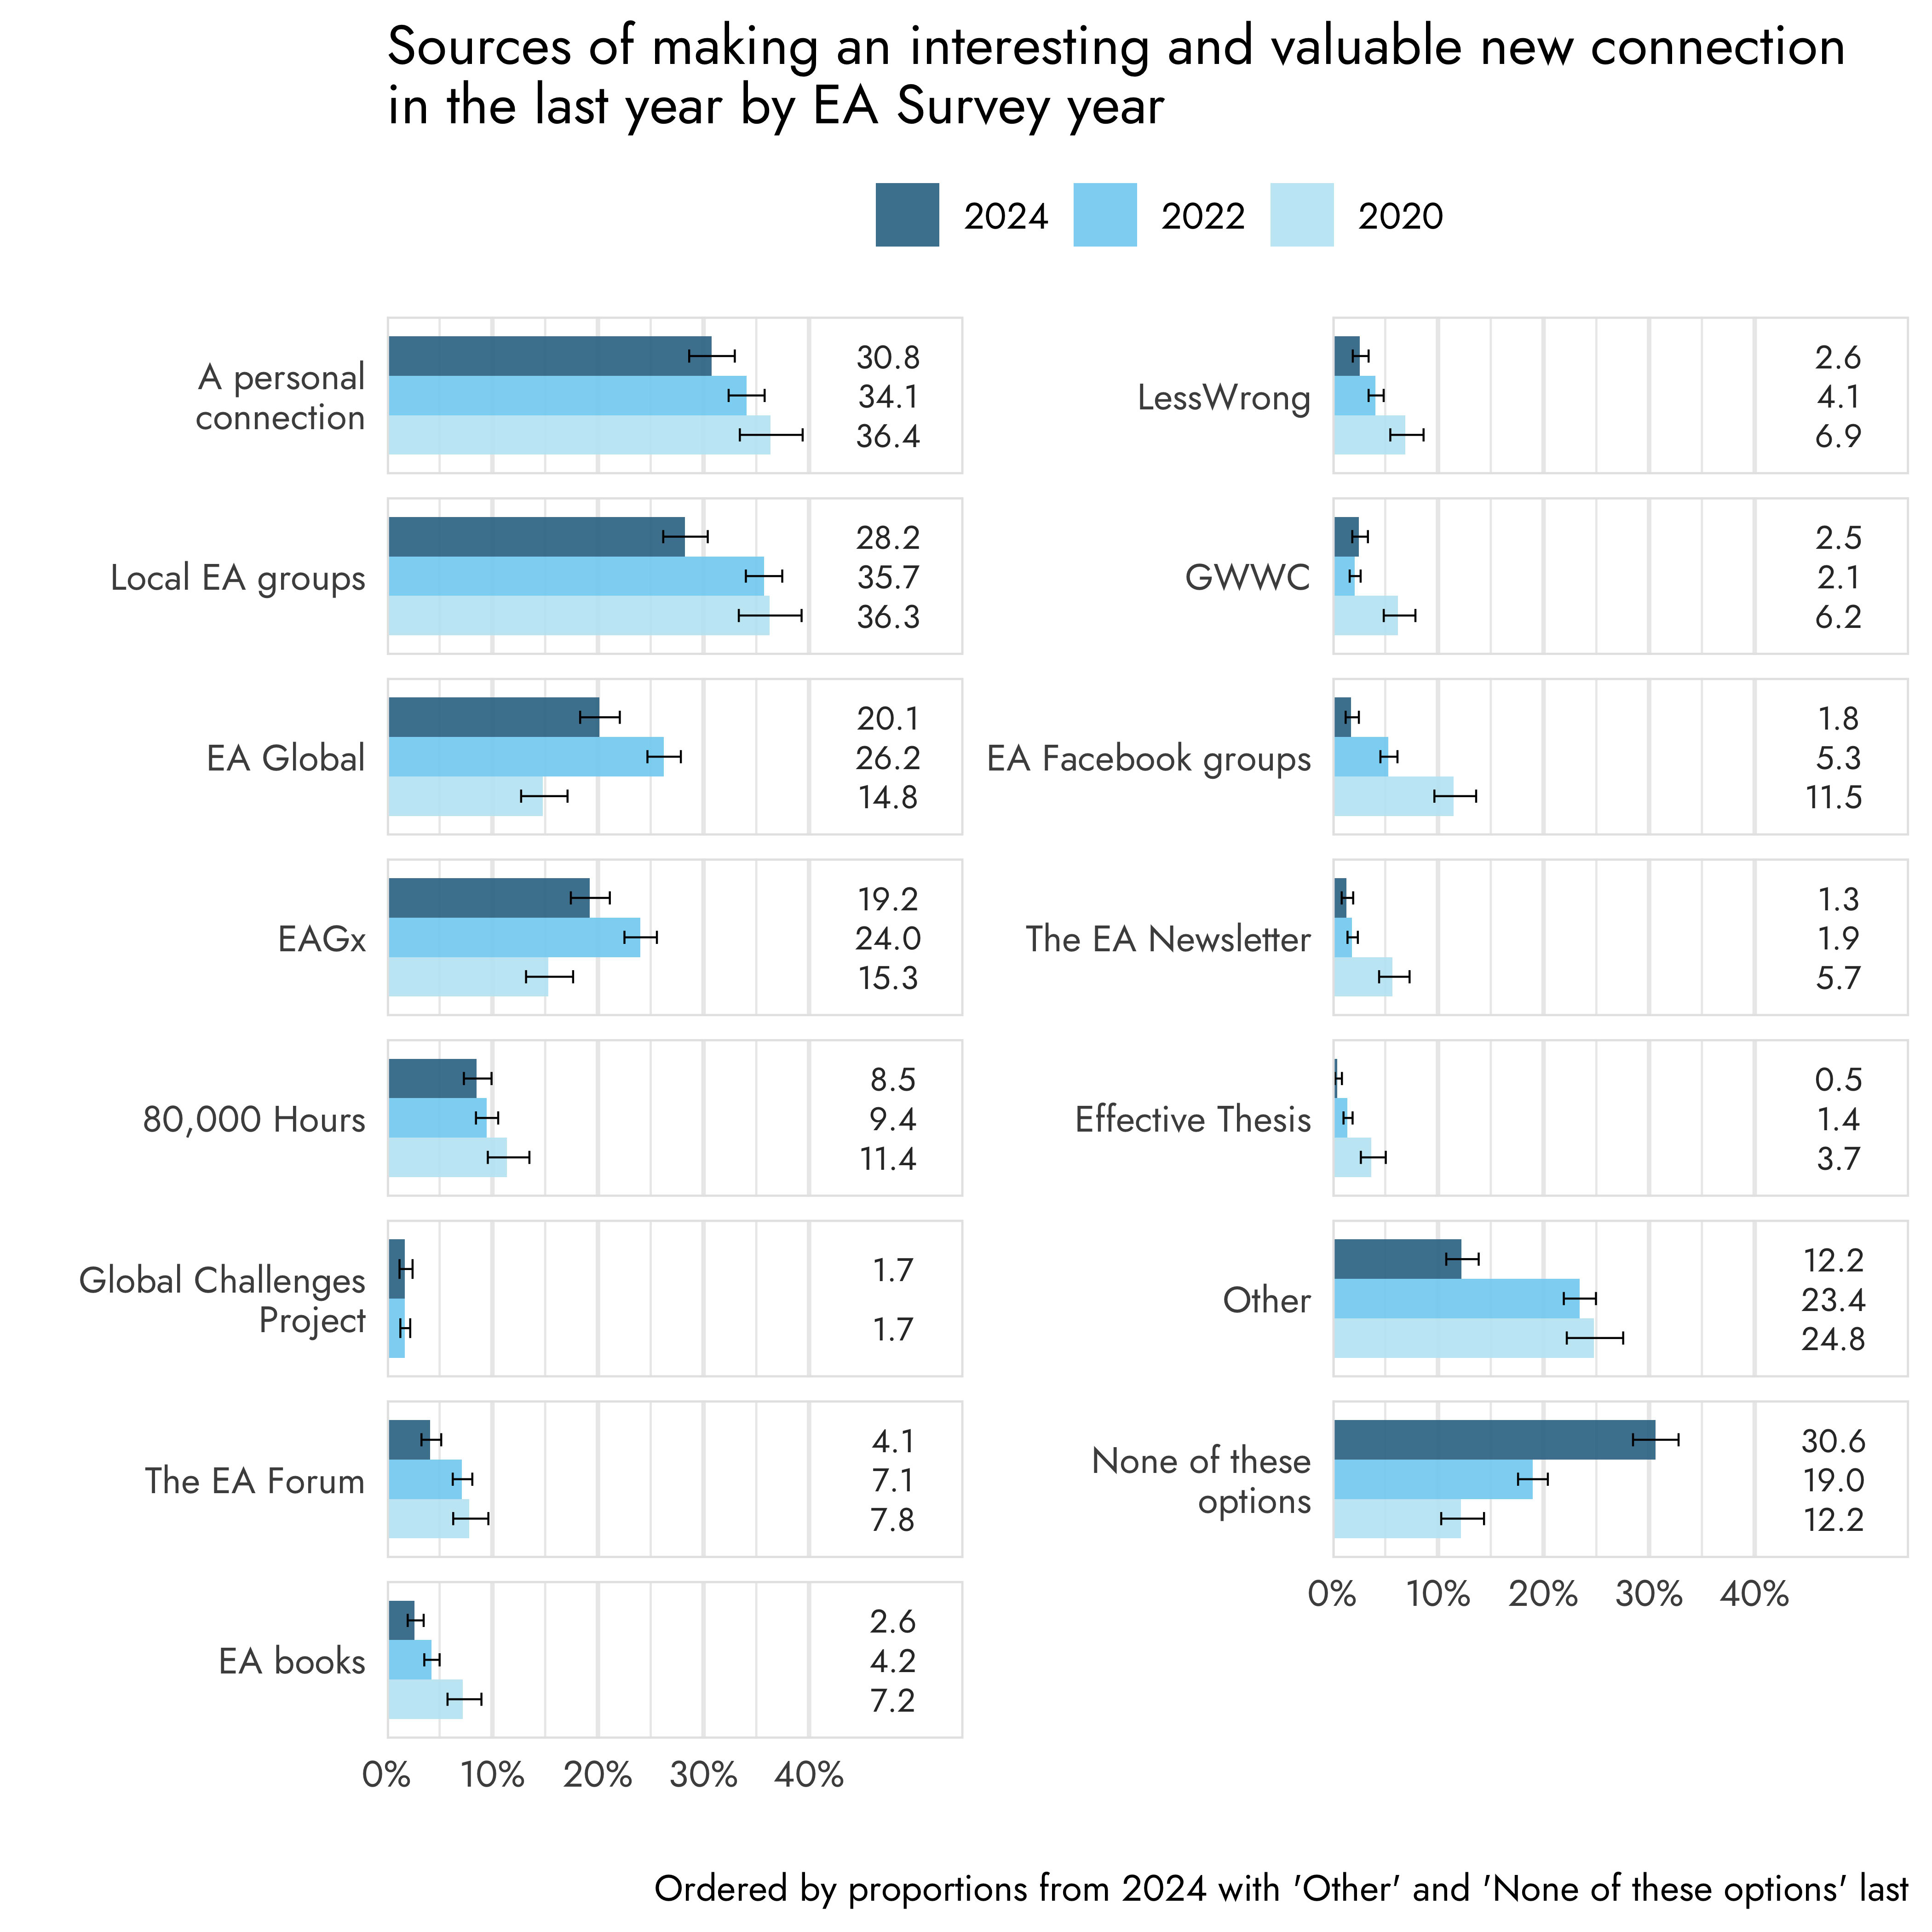
Notably, the only increase between 2022 and 2024 that was observed was an increase in the ‘None of the options’ category (from 19% to 30.6%). Consistent with that, we saw decreases for various other categories. In order of size, we saw a decrease in local EA groups (35.7% to 28.2%), EA Global (26.2% to 20.1%), EAGx (24% to 19.2%), EA Facebook groups (5.3% to 1.8%), the EA Forum (7.1% to 4.1%), a personal connection (34.1% to 30.8%), EA books (4.2% to 2.6%), LessWrong (4.1% to 2.6%), and Effective Thesis (1.4% to 0.5%).
There was also a decrease in the ‘Other’ category (from 23.4% to 12.2%).
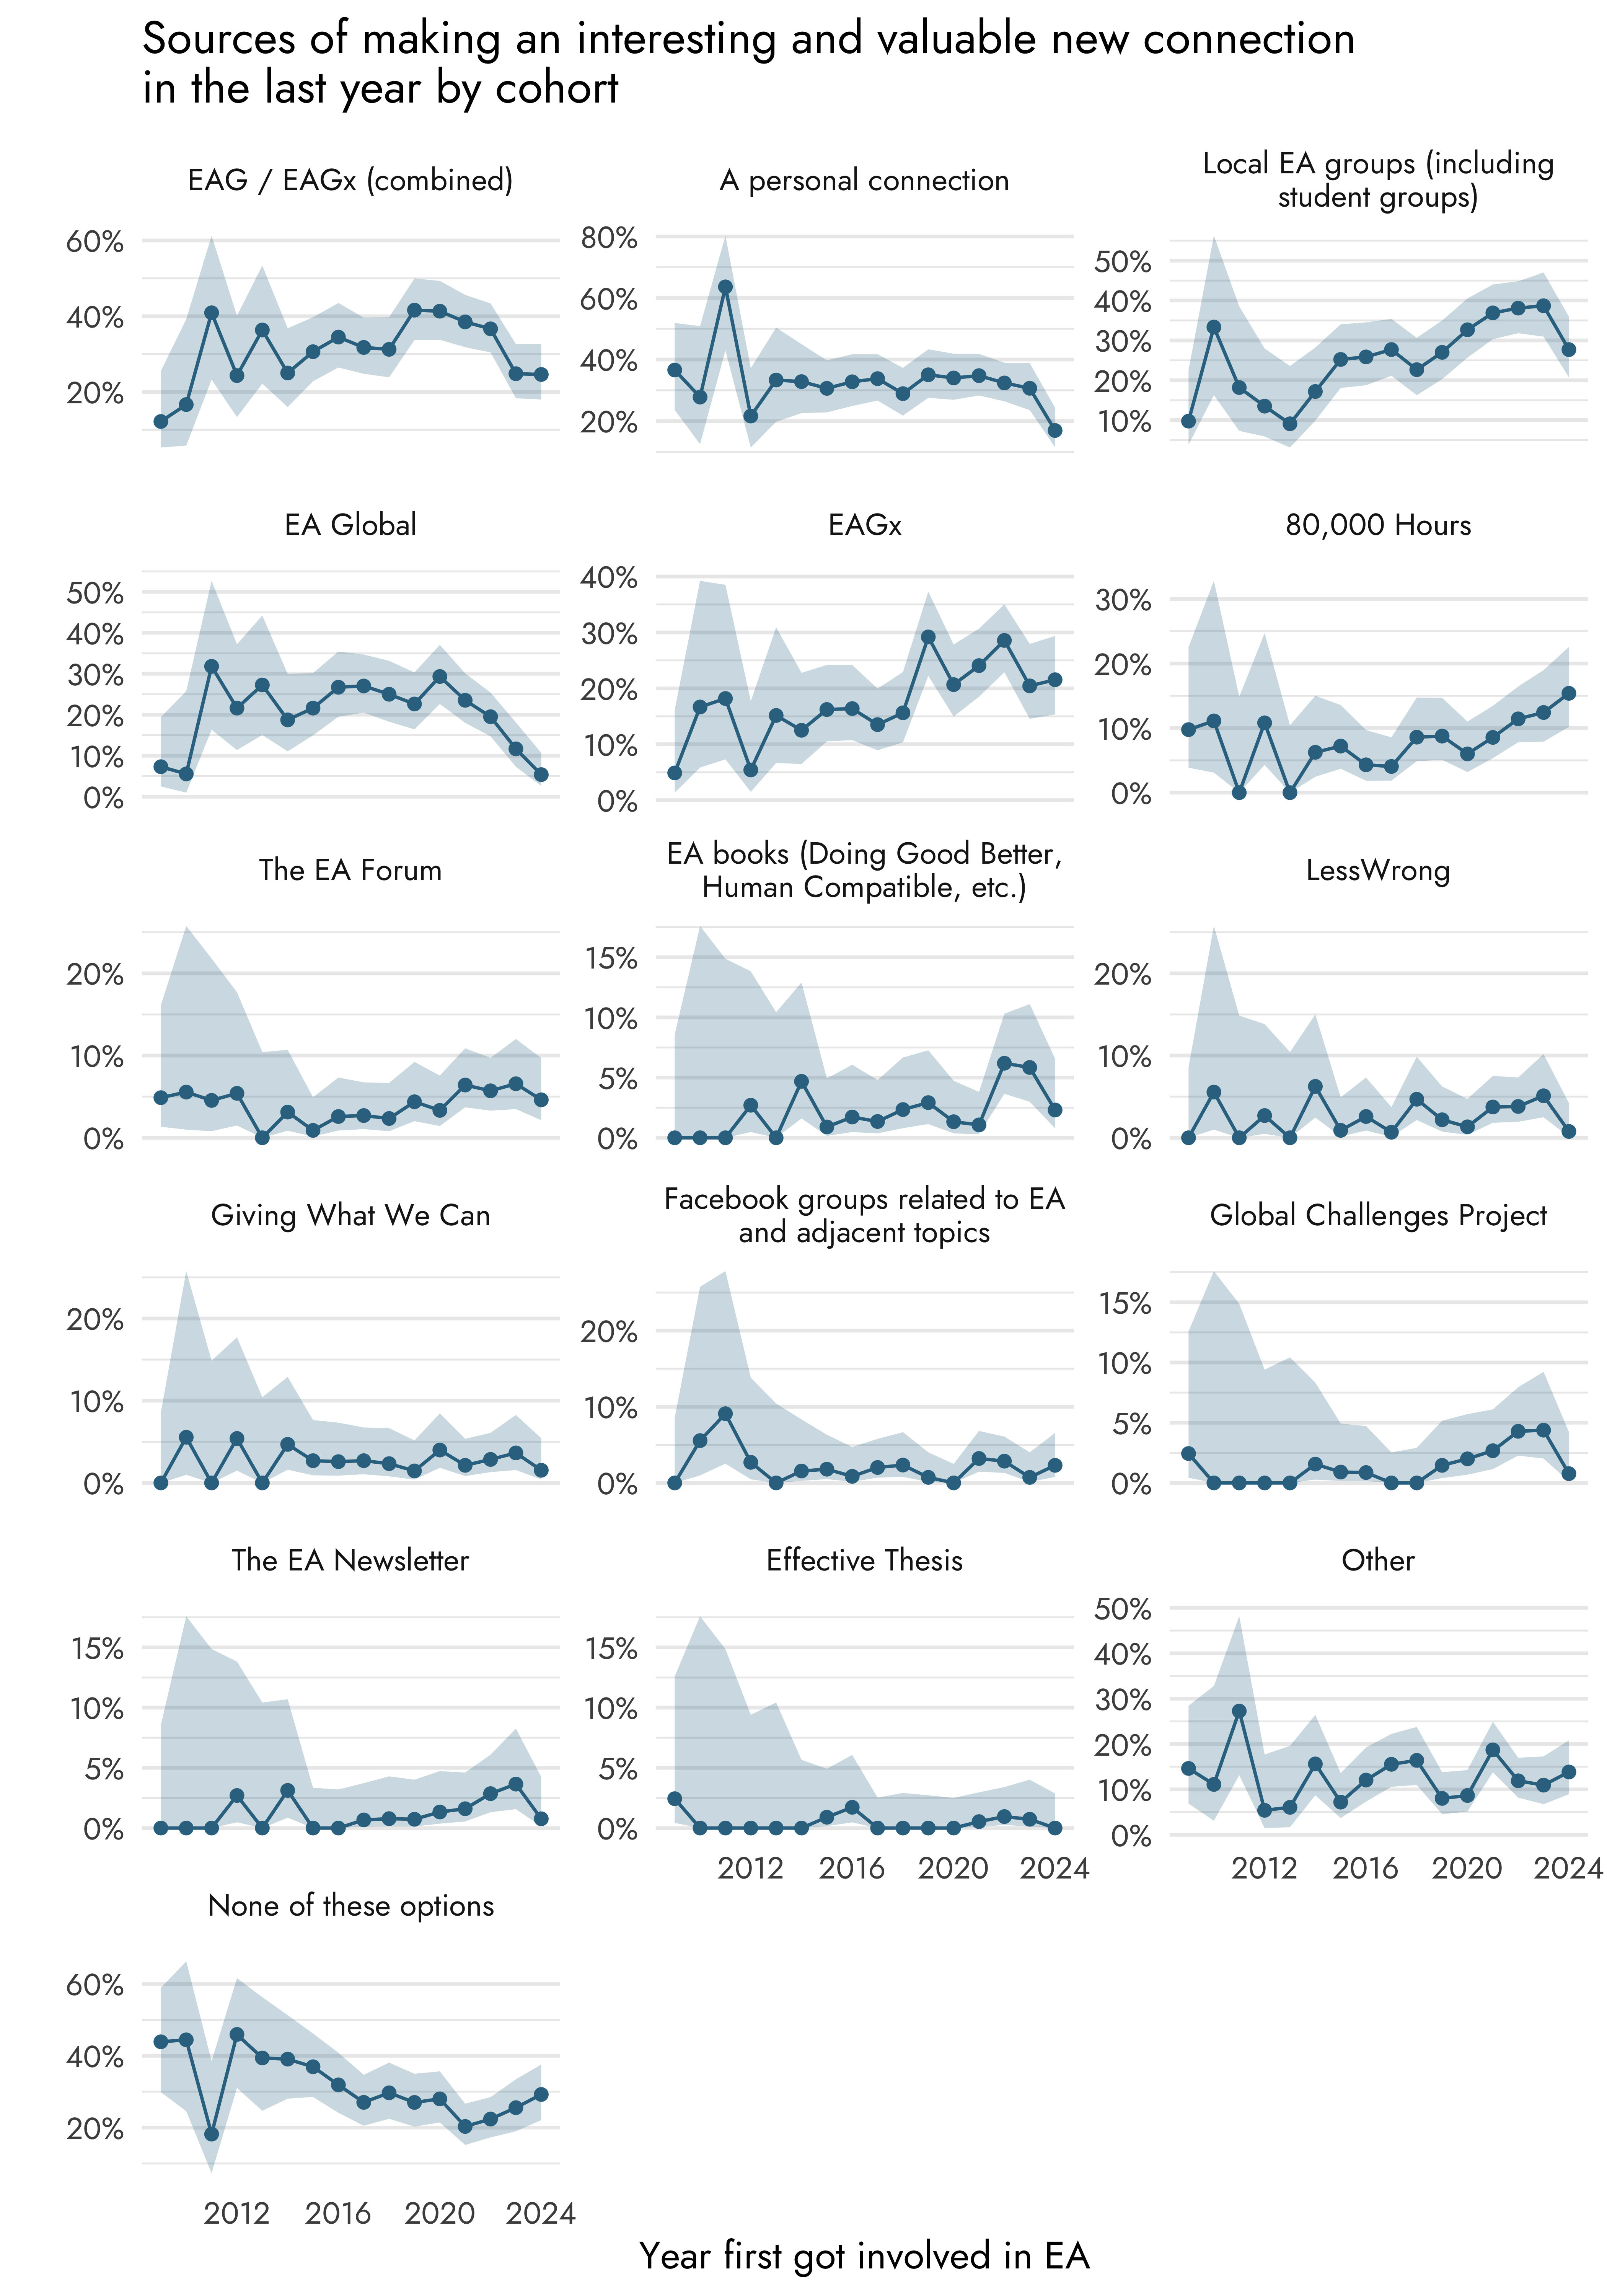
We also looked at cohorts effects, as shown in the graph below (for an alternative graph with variable y-axes per source, see Appendix 3).
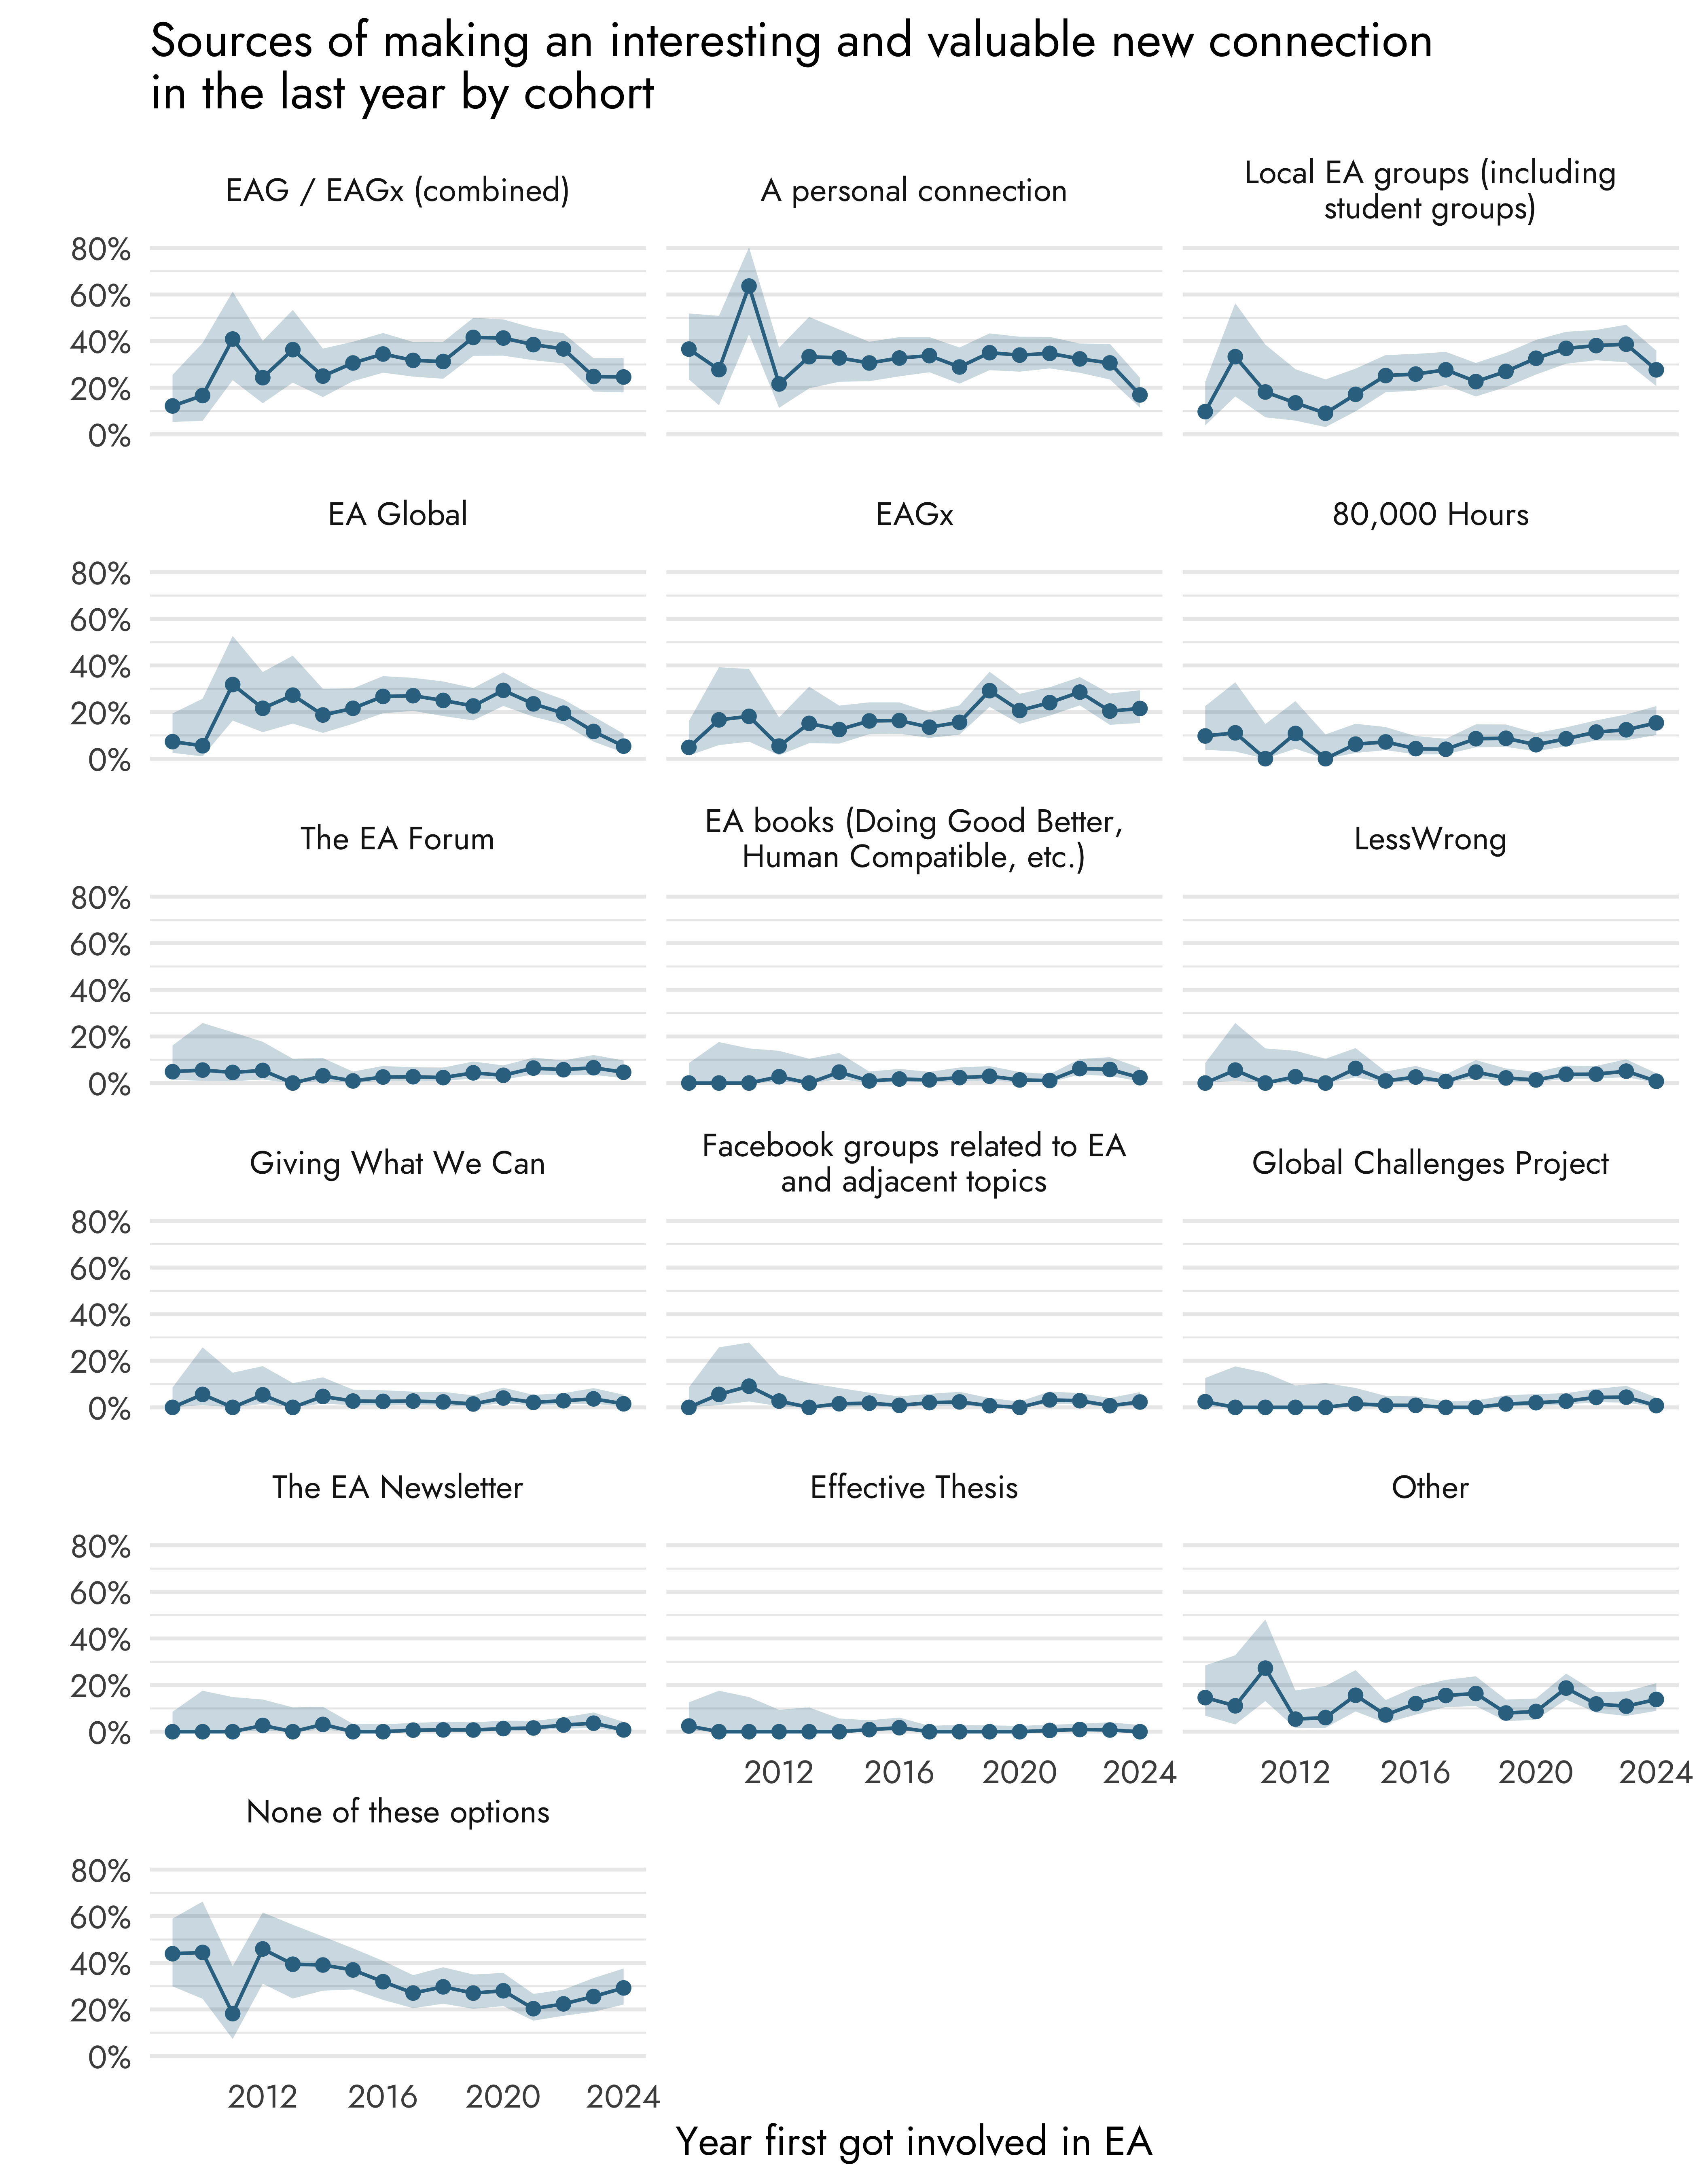
In terms of cohorts, we see several differences between the most recent cohorts and older cohorts. The combined category of EA Global and EAG is less popular among the most recent cohorts, which appears to be due to recent cohorts being less likely to make new connections at EA Global specifically, with no such effect seen for EAGx. There also appears to be a drop for the category ‘a personal connection’ between the most recent cohort and older cohorts, with a similar drop seen for local EA groups, although recent cohorts other than the most recent cohort seemed to select this category more frequently compared to the oldest cohorts. The same pattern was found for the Global Challenges Project and the EA Newsletter, with a generally upward trend for recent cohorts, except the most recent cohort
80,000 Hours, on the other hand, was selected more frequently by more recent cohorts, including the most recent cohort.
Group differences
Group differences about where new connections are made were analyzed in the same way as in the positive influences section.
Gender
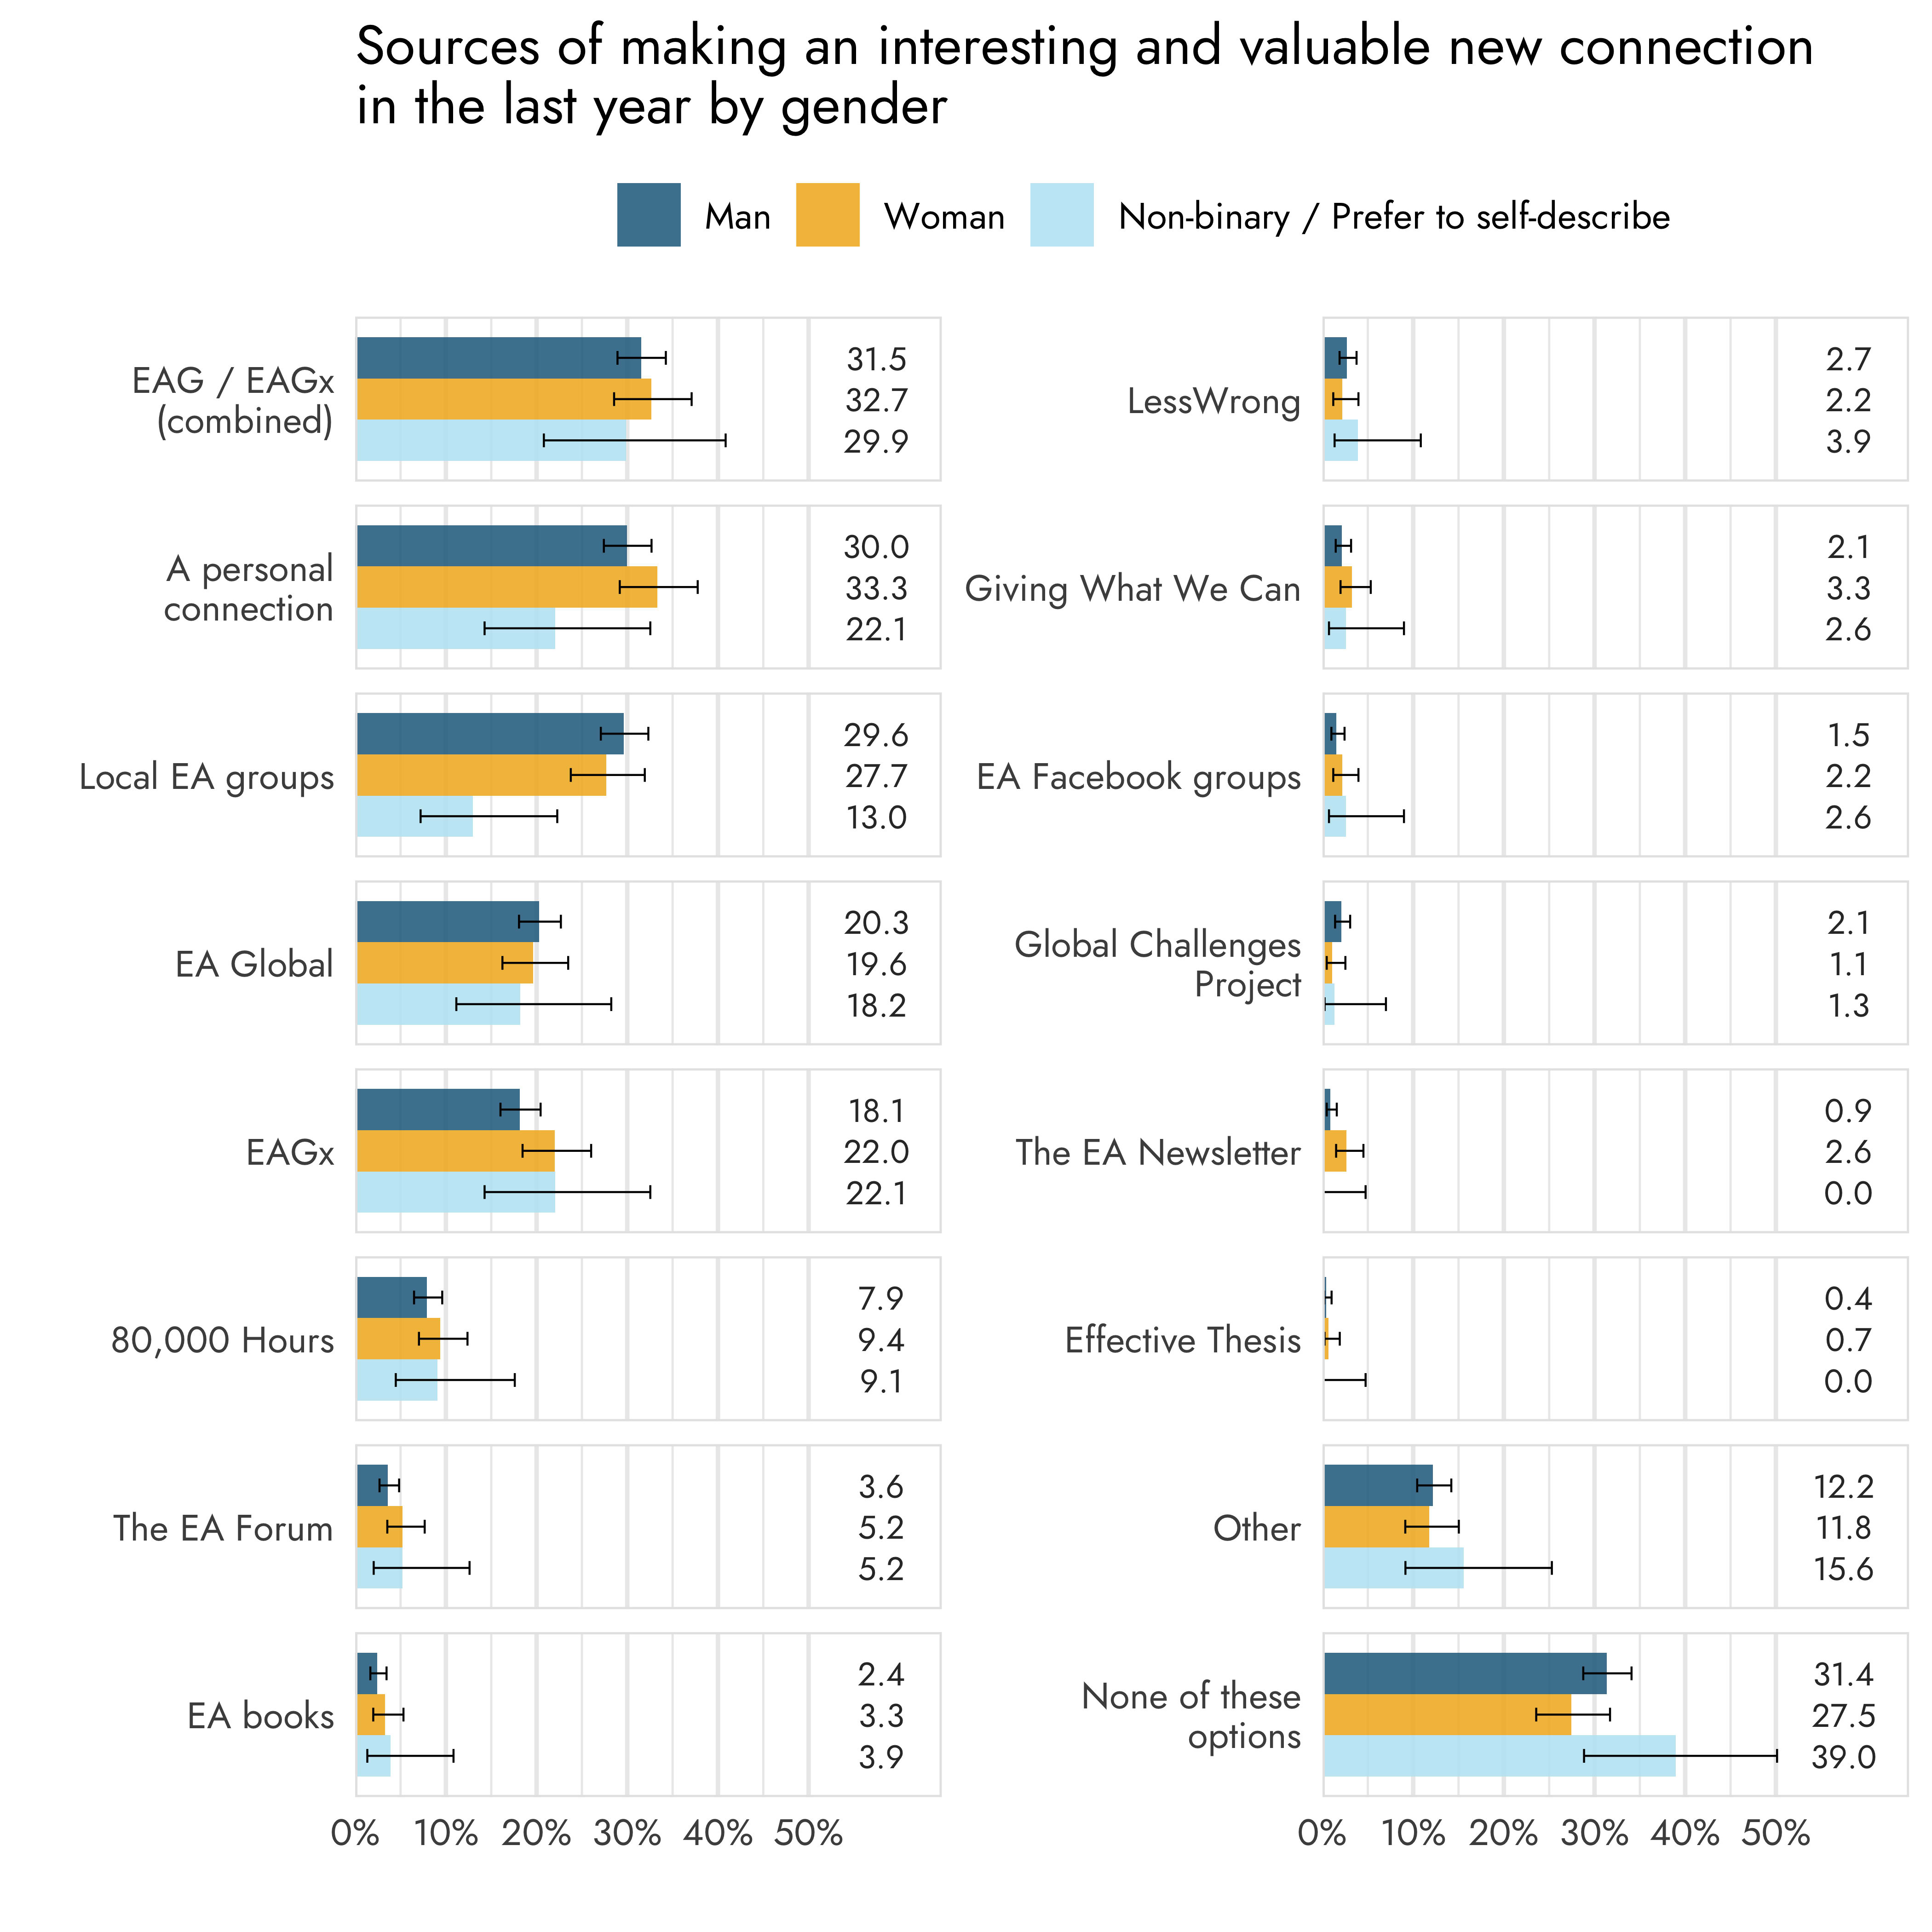
The most frequently selected sources for making new connections differed somewhat between the gender categories in terms of rankings, although most of the differences were quite minimal.
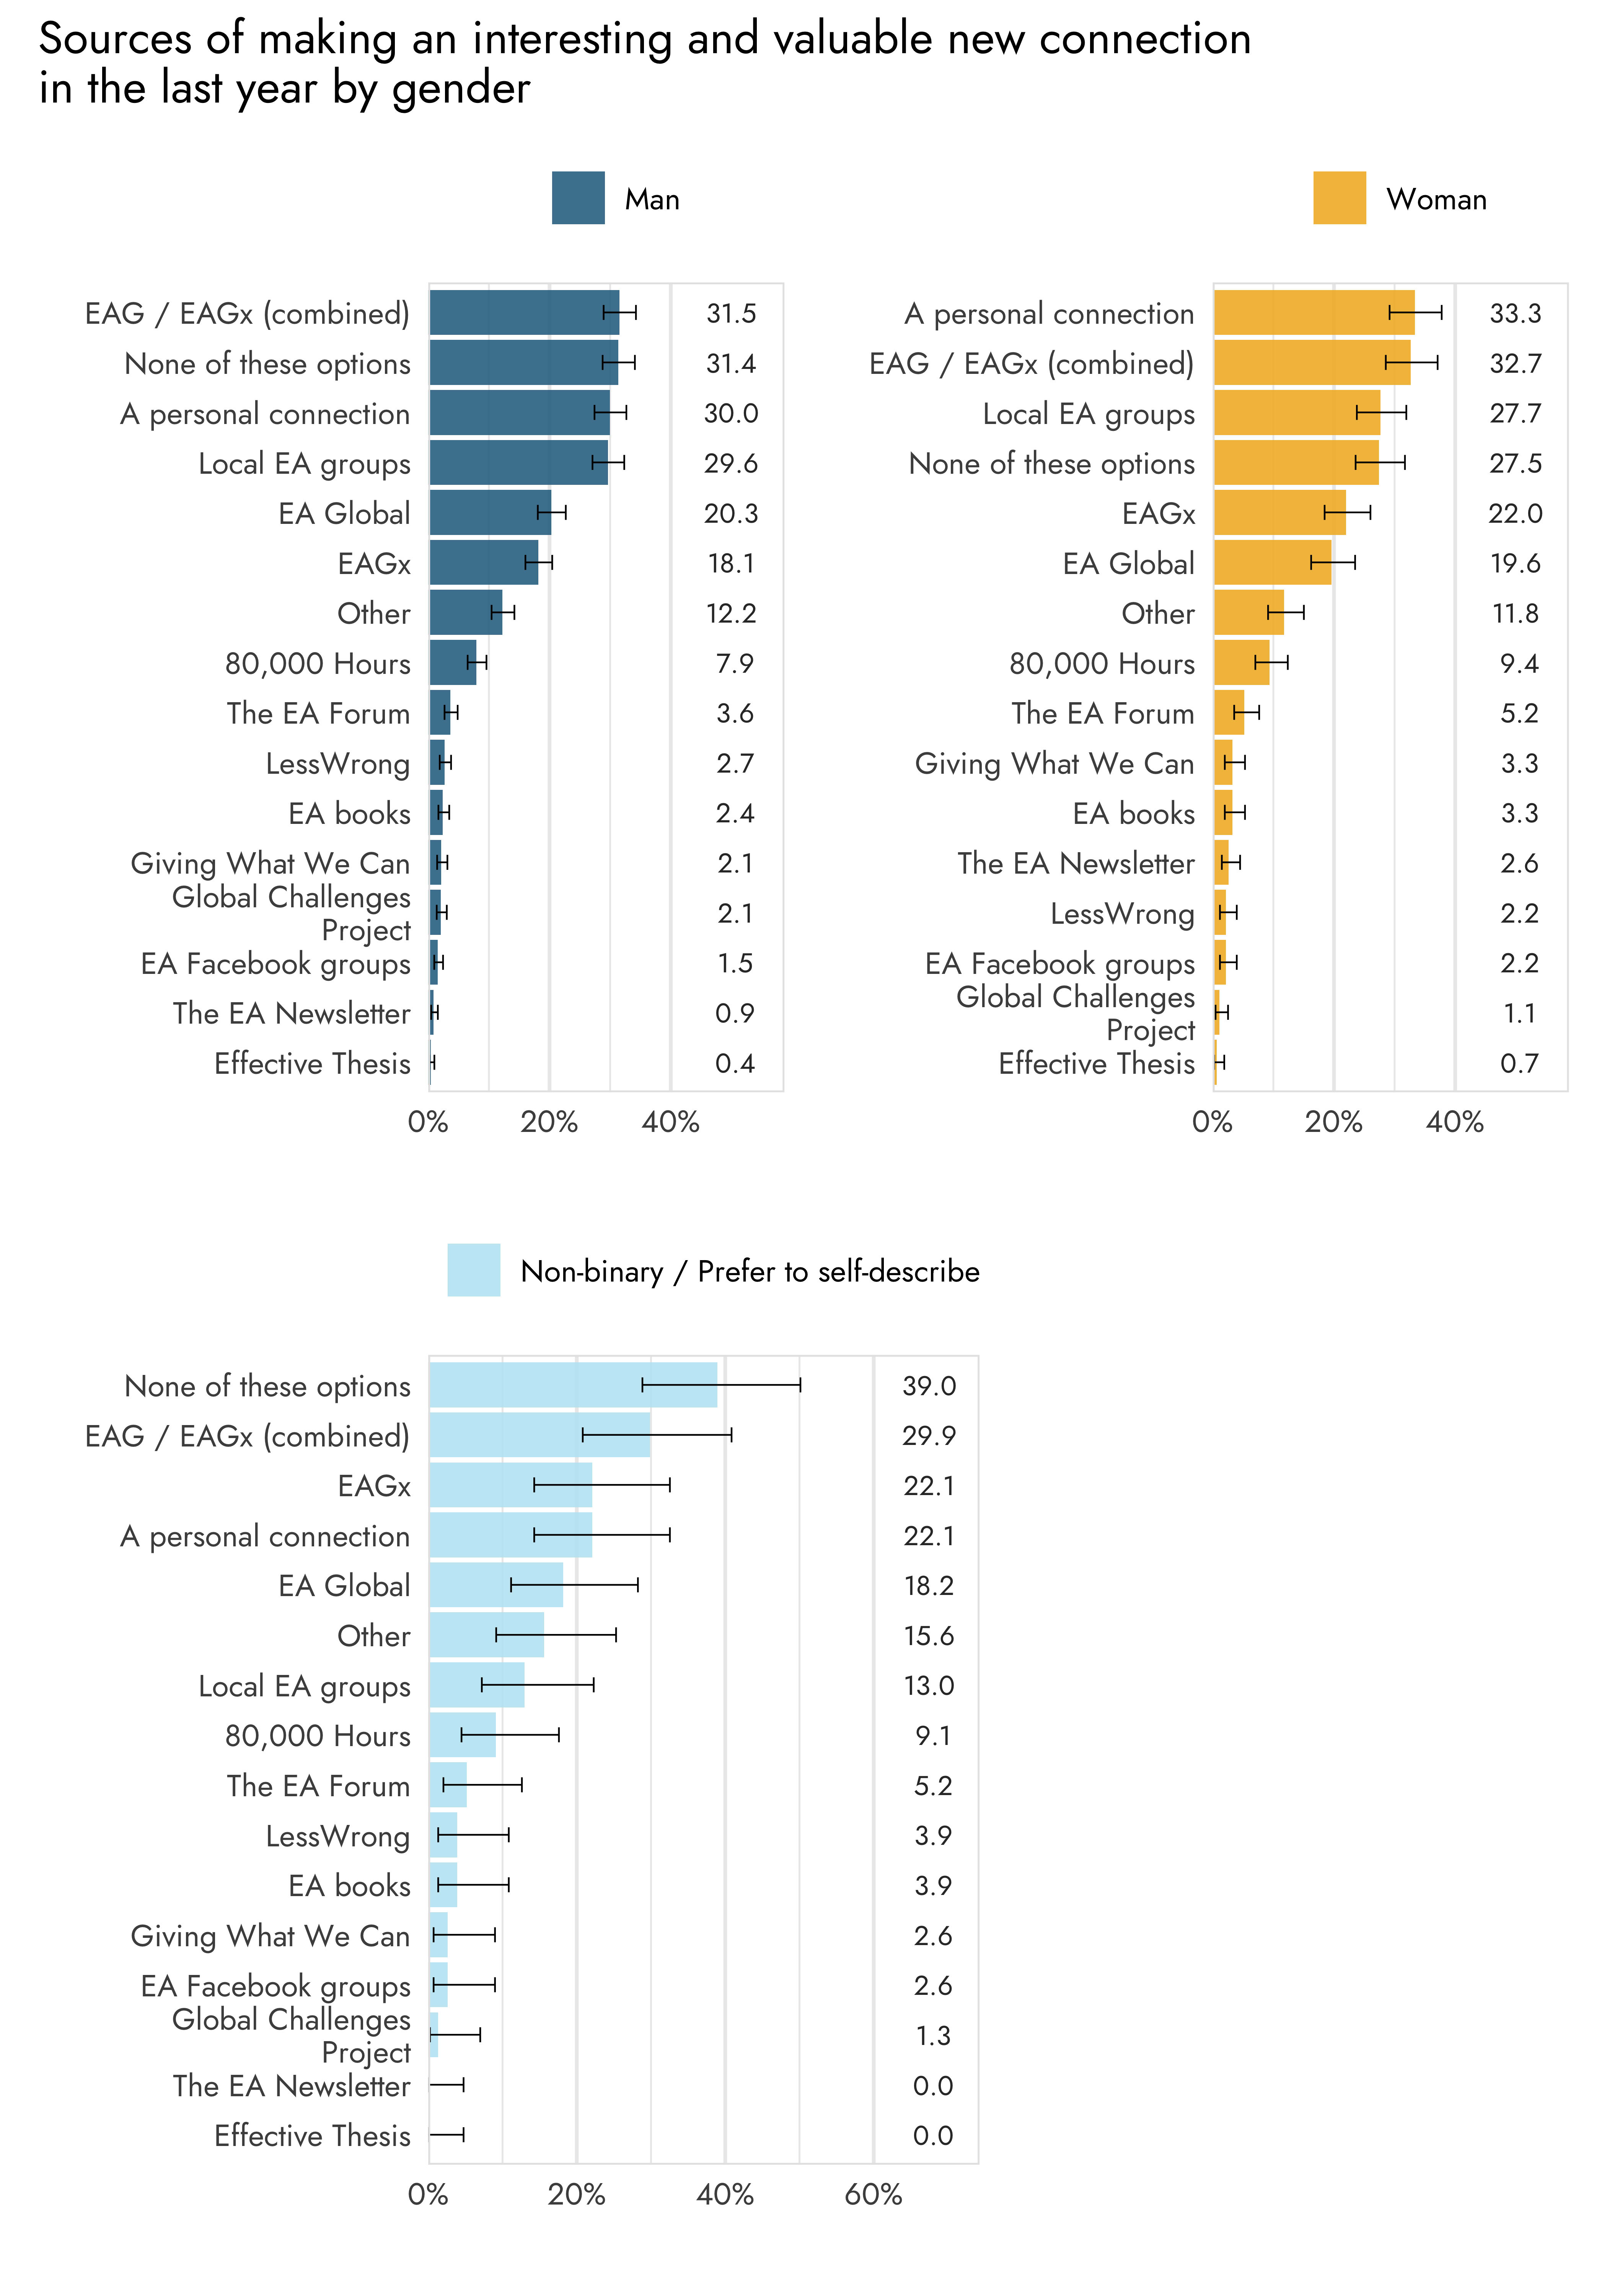
The only significant difference between men and women was that women were more likely to have selected the EA Newsletter compared to men (2.6% vs. 0.9%).
We did observe a few more differences with non-binary respondents or respondents who preferred to self-describe. They were less likely to have selected an EA Group (13%) compared to both men (29.6%) and women (27.7%). They were also less likely to select a personal connection (22.1%), but a significant difference was only found compared to women (33.3%).
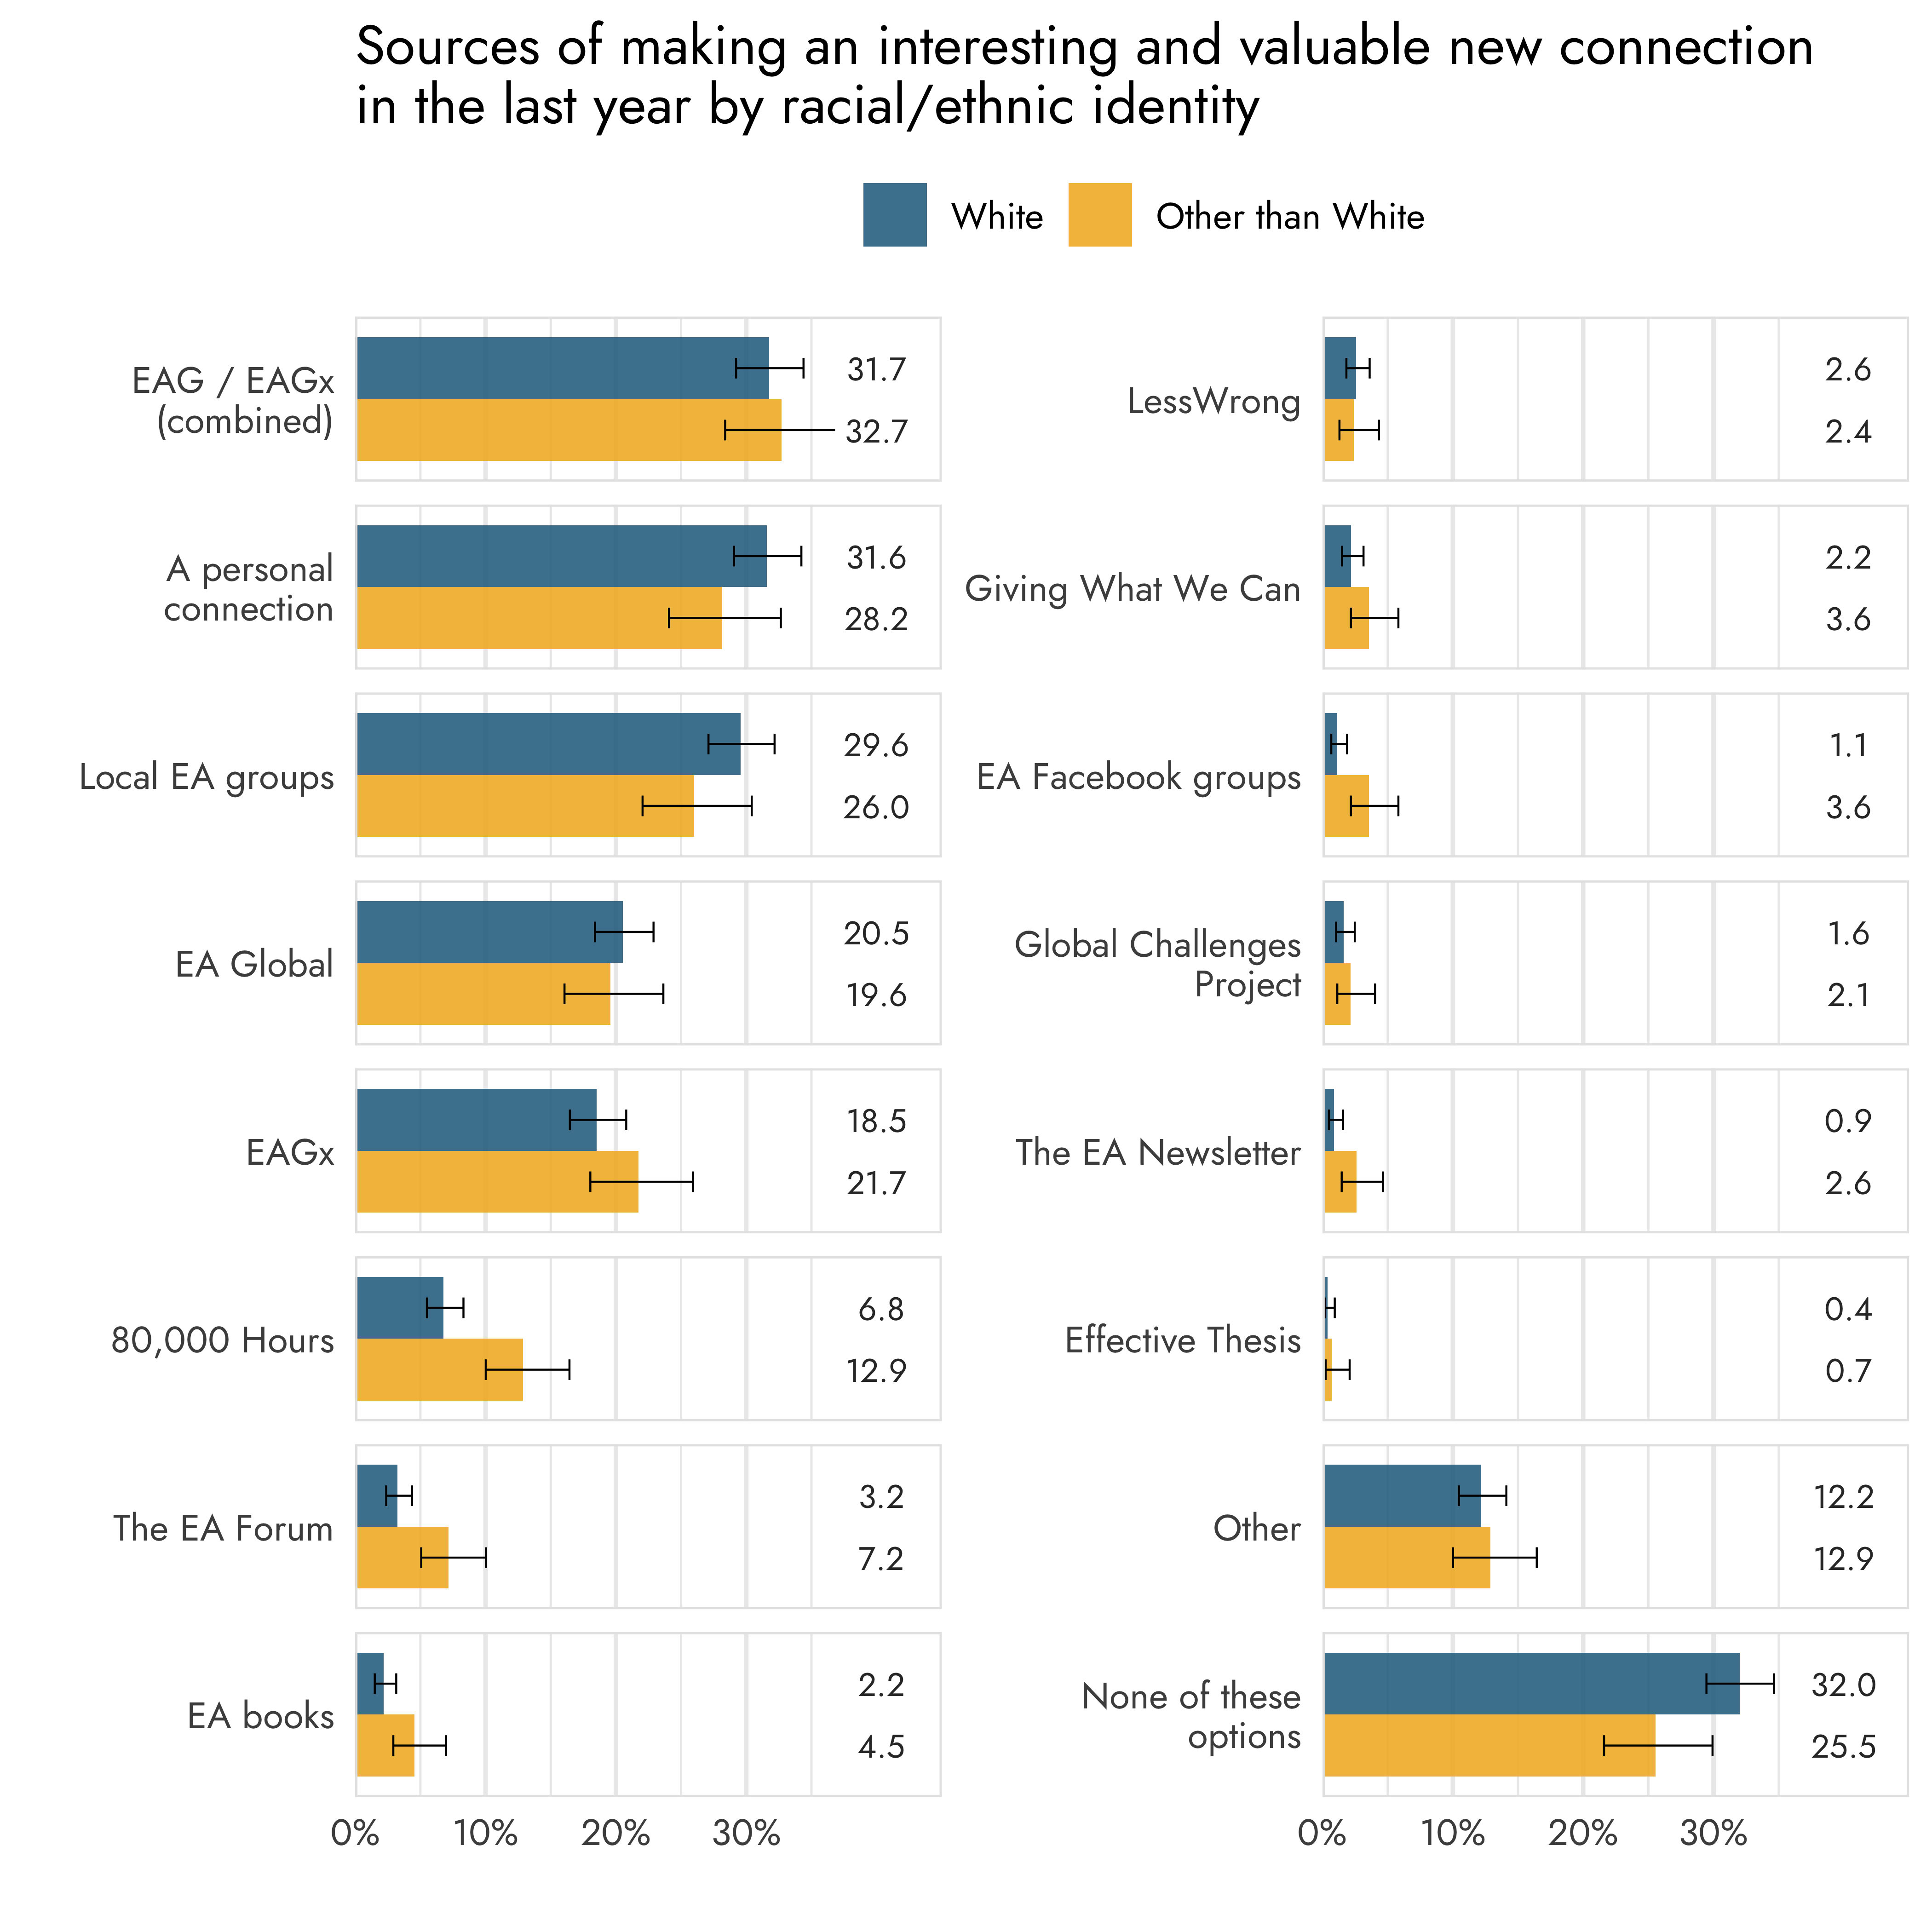
Racial/ethnic identity
Some differences were found between White and respondents other than White in terms of sources of new connections, although the most important factors were similar.
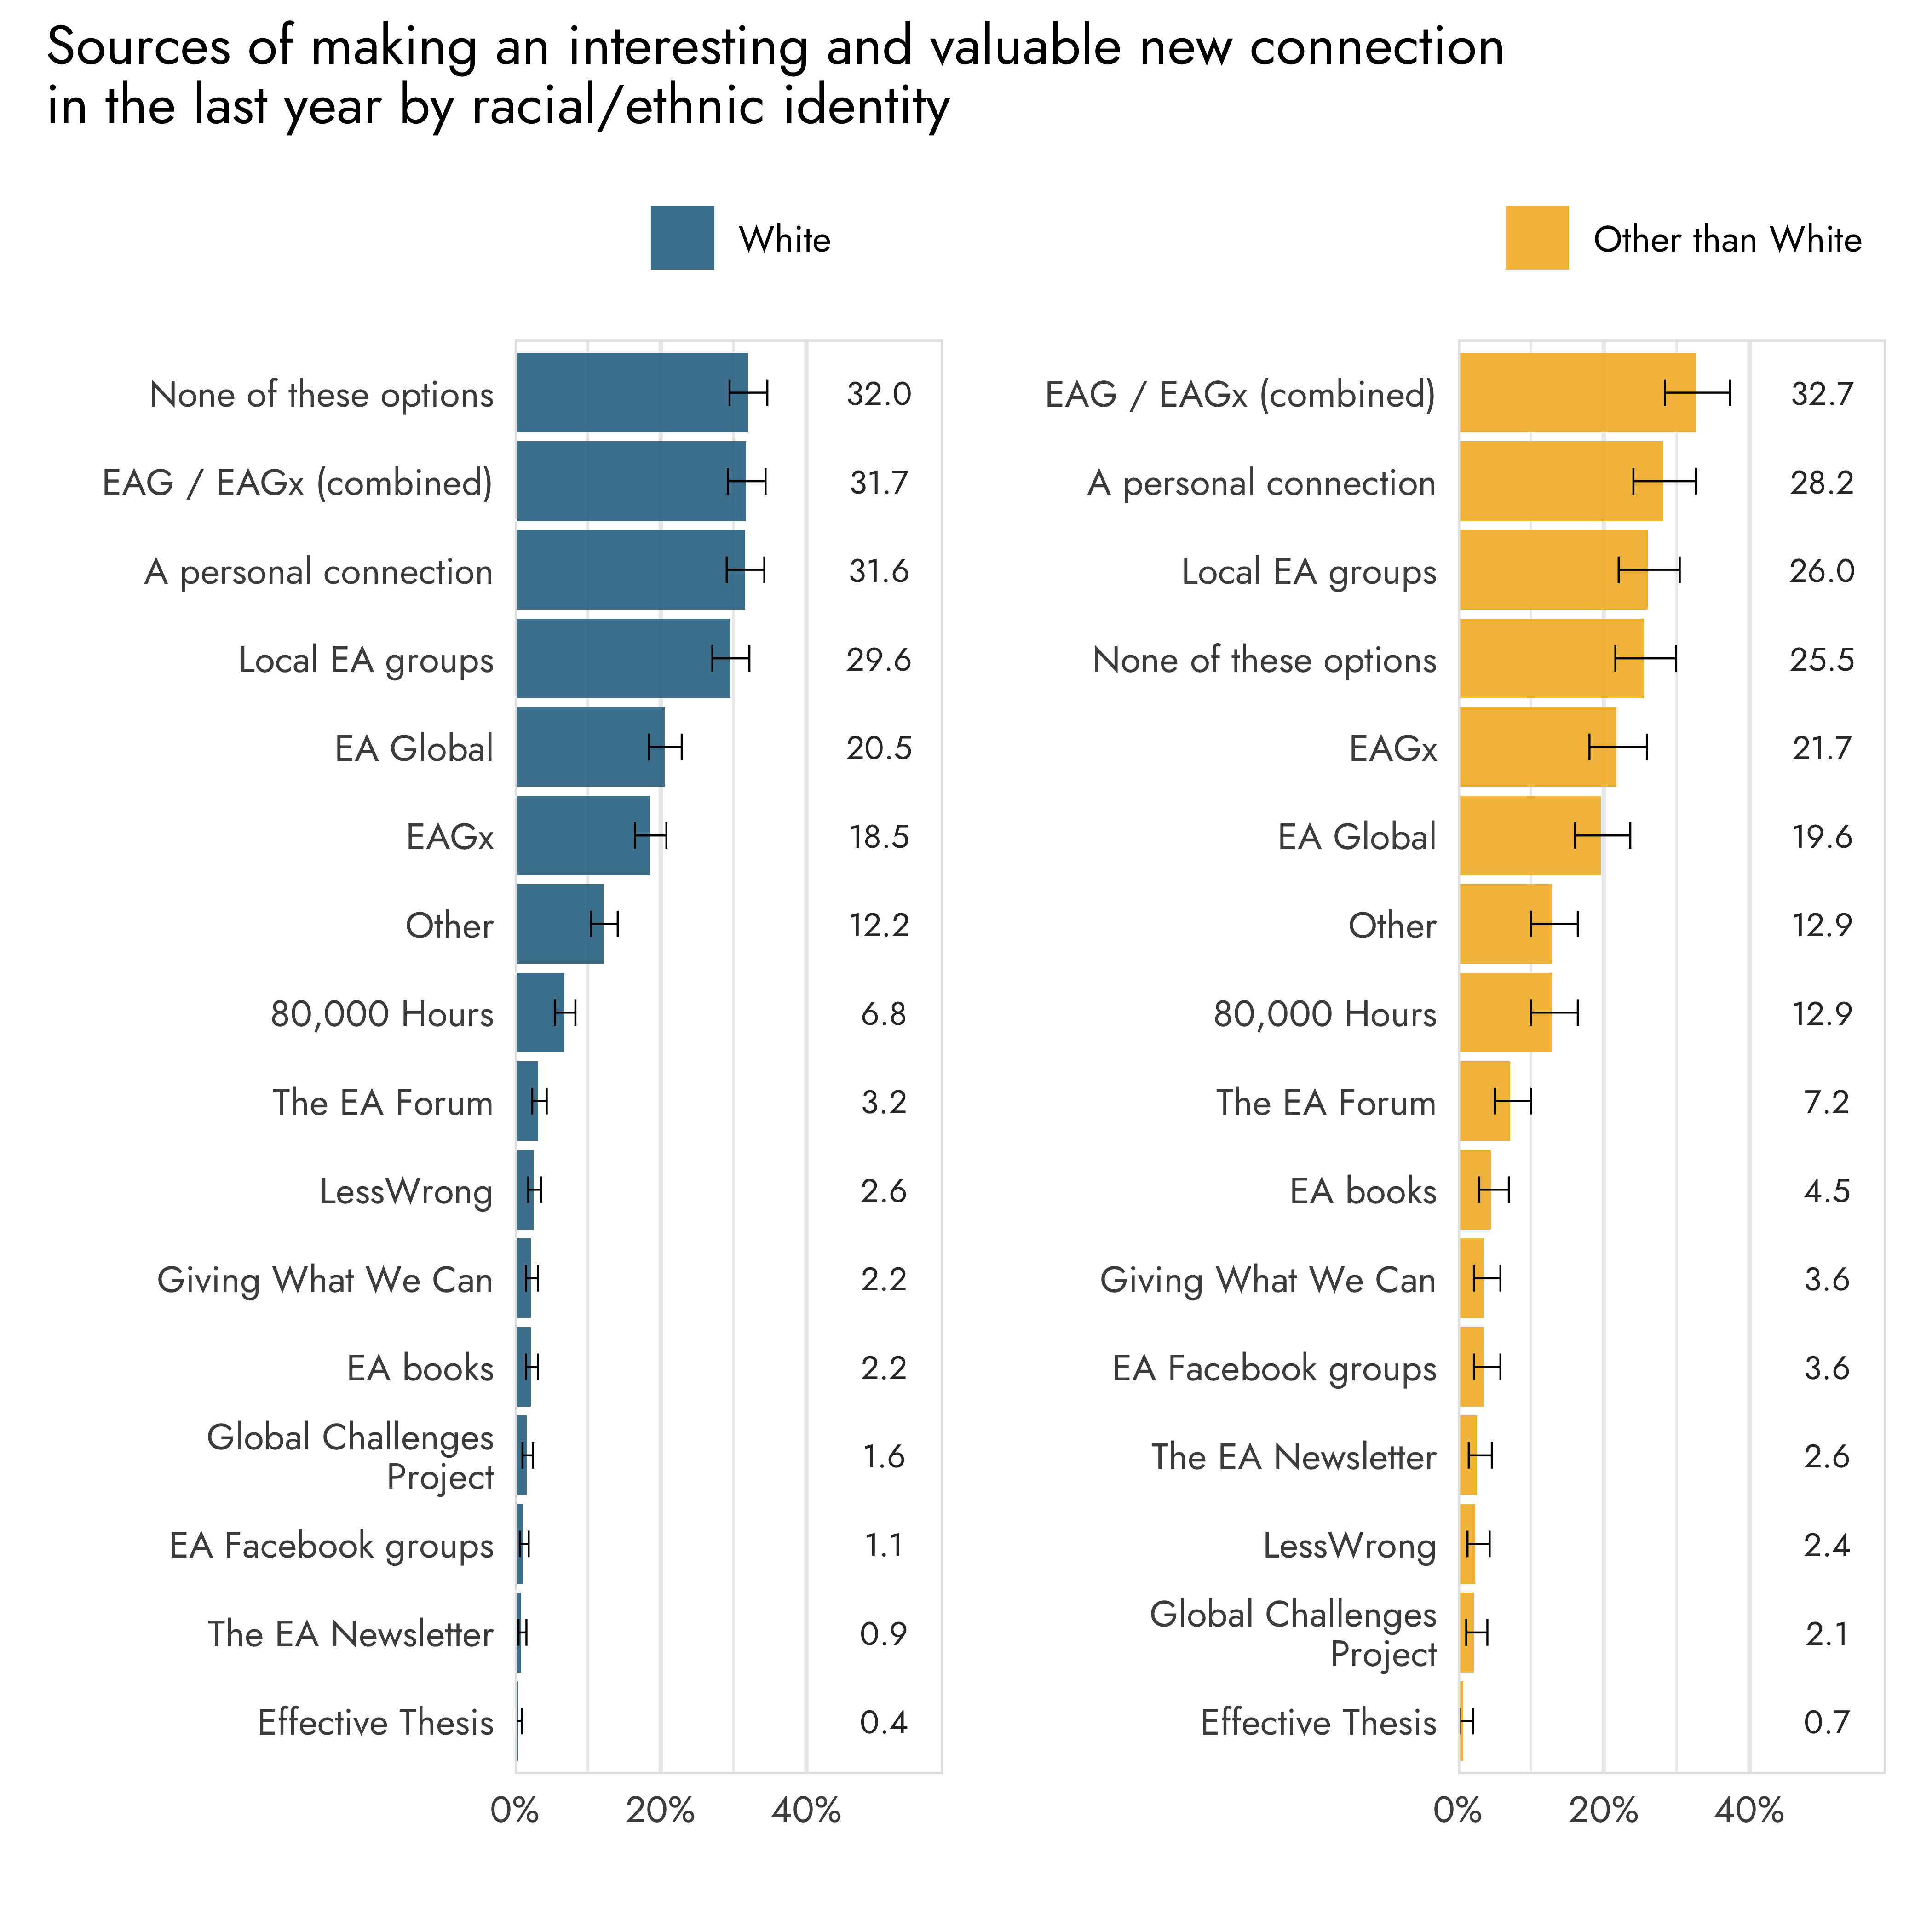
Non-white respondents were more likely to have selected 80,000 Hours (12.9% vs. 6.8%), the EA Forum (7.2% vs. 3.2%), Facebook groups (3.6% vs. 1.1%), EA books (4.5% vs. 2.2%), and the EA newsletter (2.6% vs. 0.9%).
White respondents, on the other hand, were more likely to have selected ‘None of these options’ (32% vs. 25.2%).
Engagement
More, and more sizable, differences were observed between low and highly EA engaged respondents.
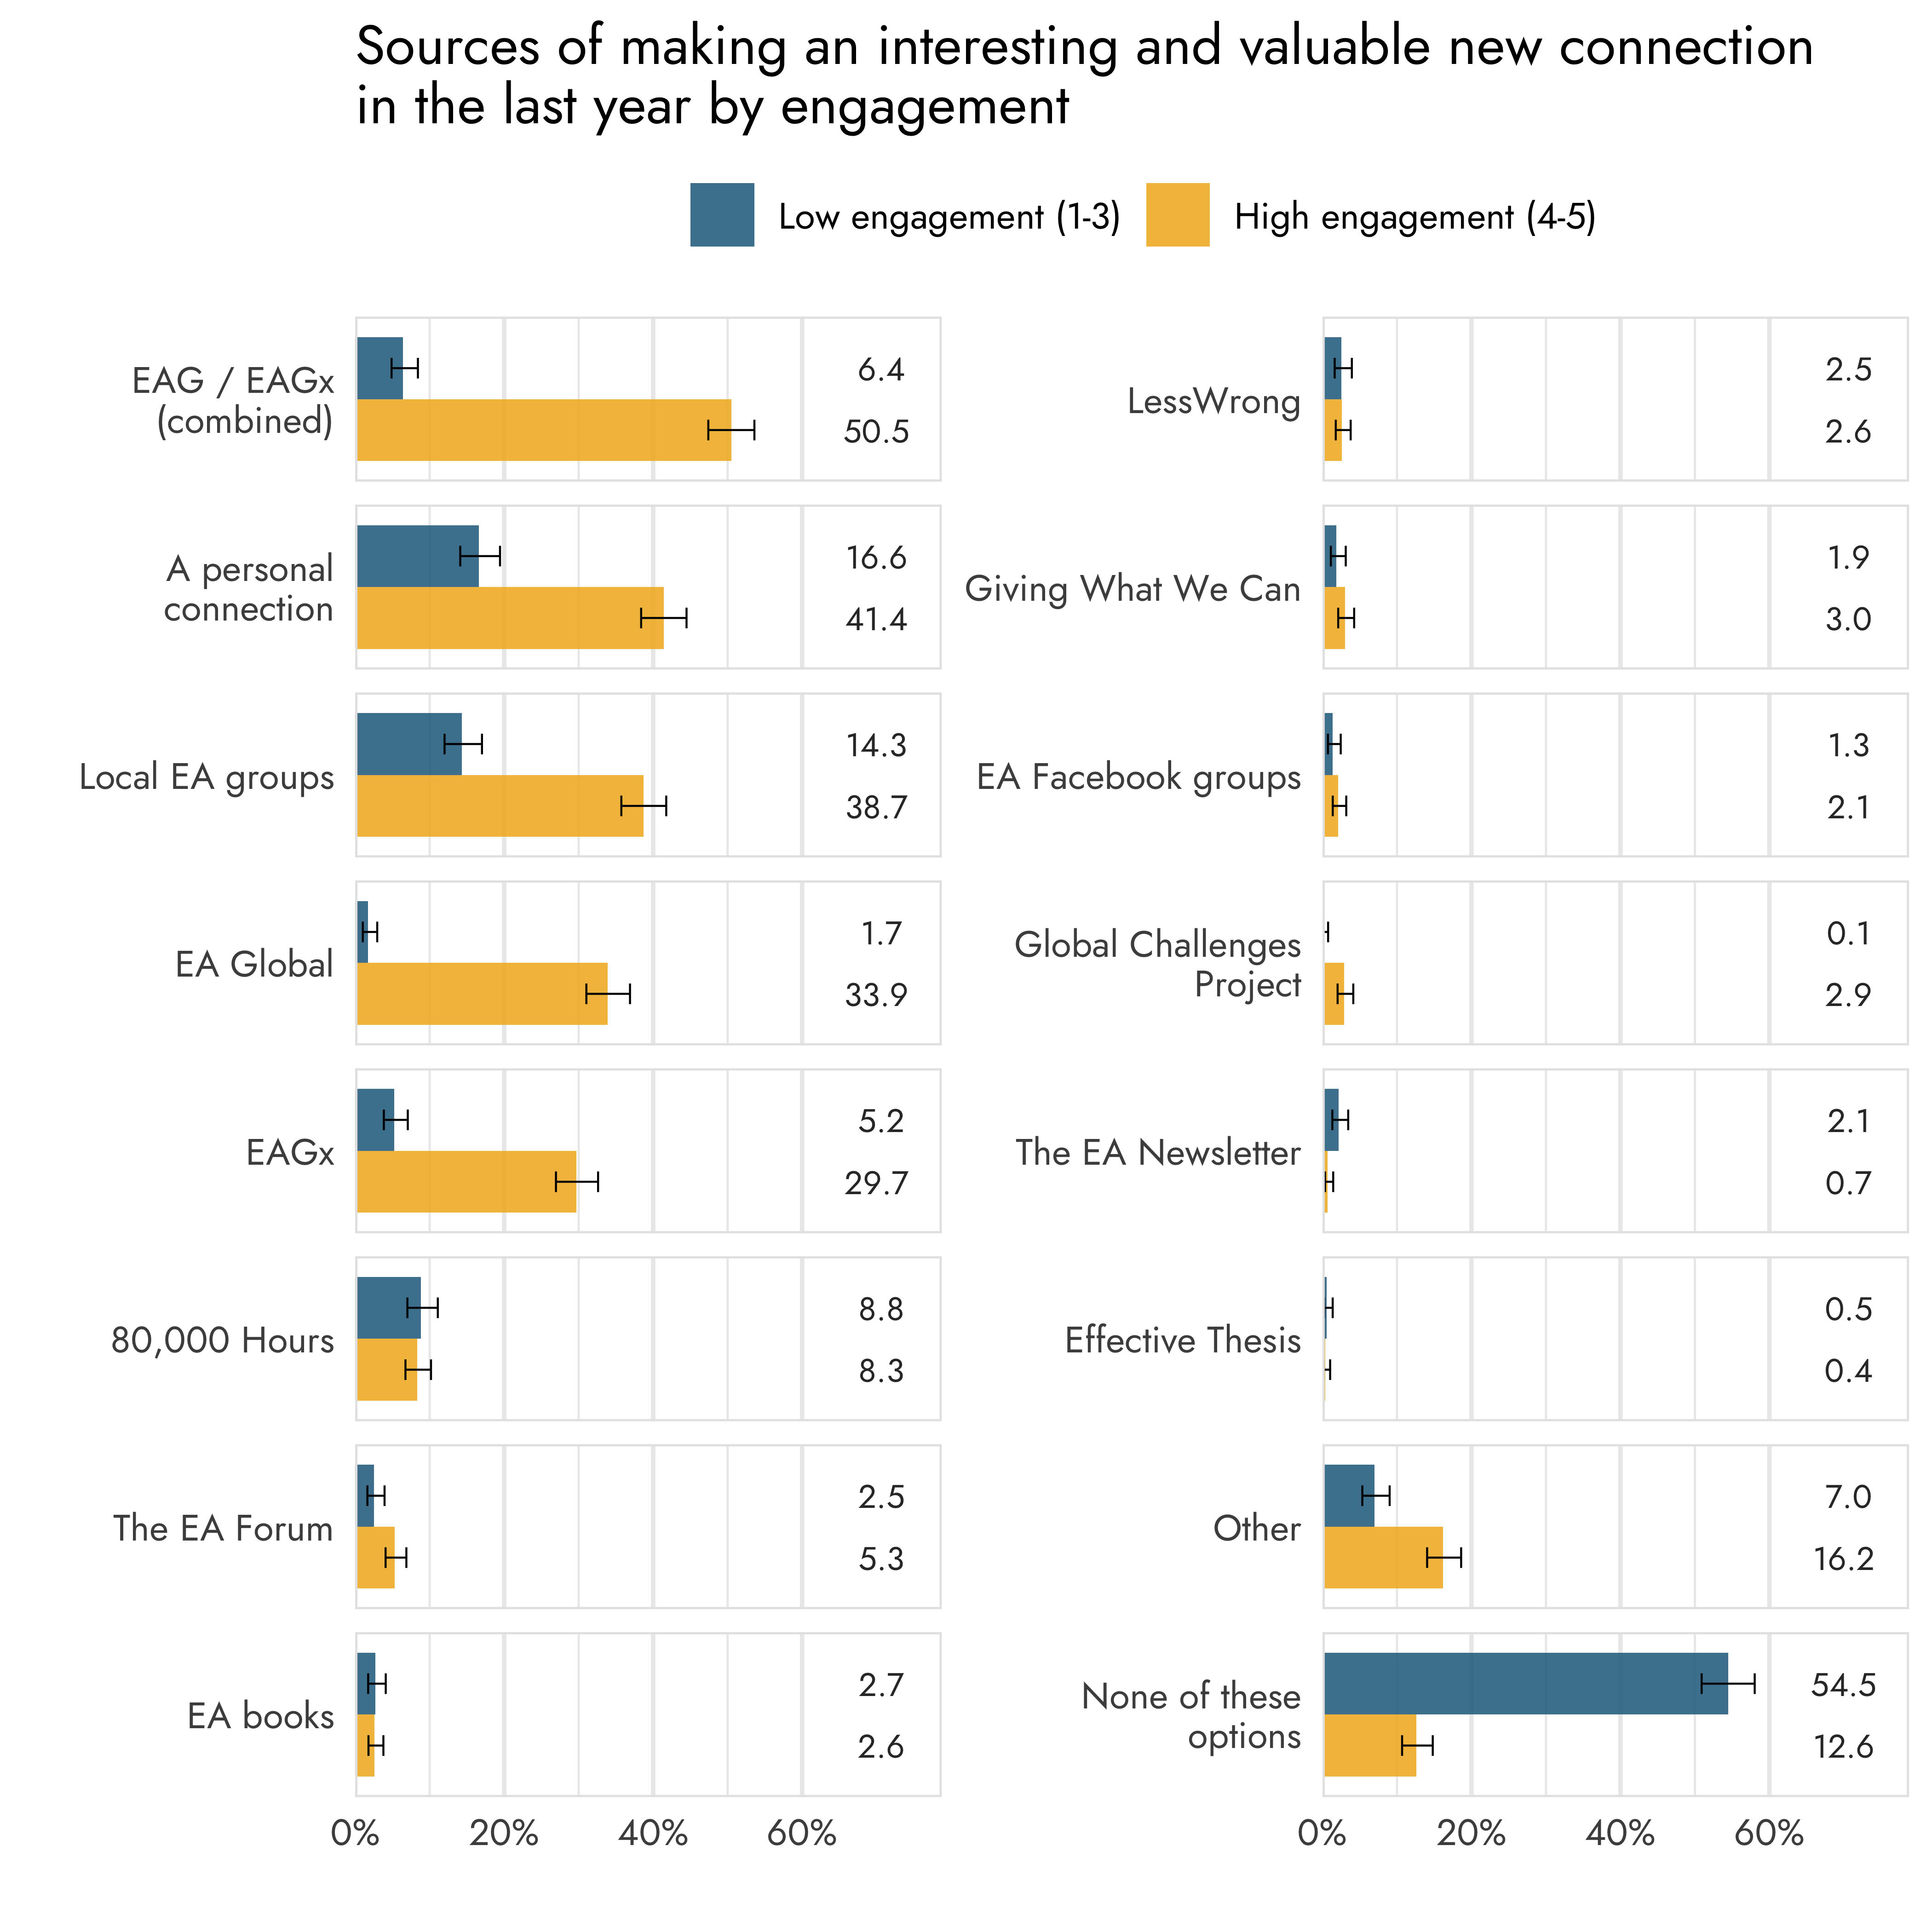
The most important source for making new connections among low engagement respondents was not a source at all, as they largely selected ‘None of these options’. This was followed by a personal connection and local EA groups, which were also in the top three for highly engaged respondents.
The most important source for highly engaged respondents was the combined category of EAG and EAGx.
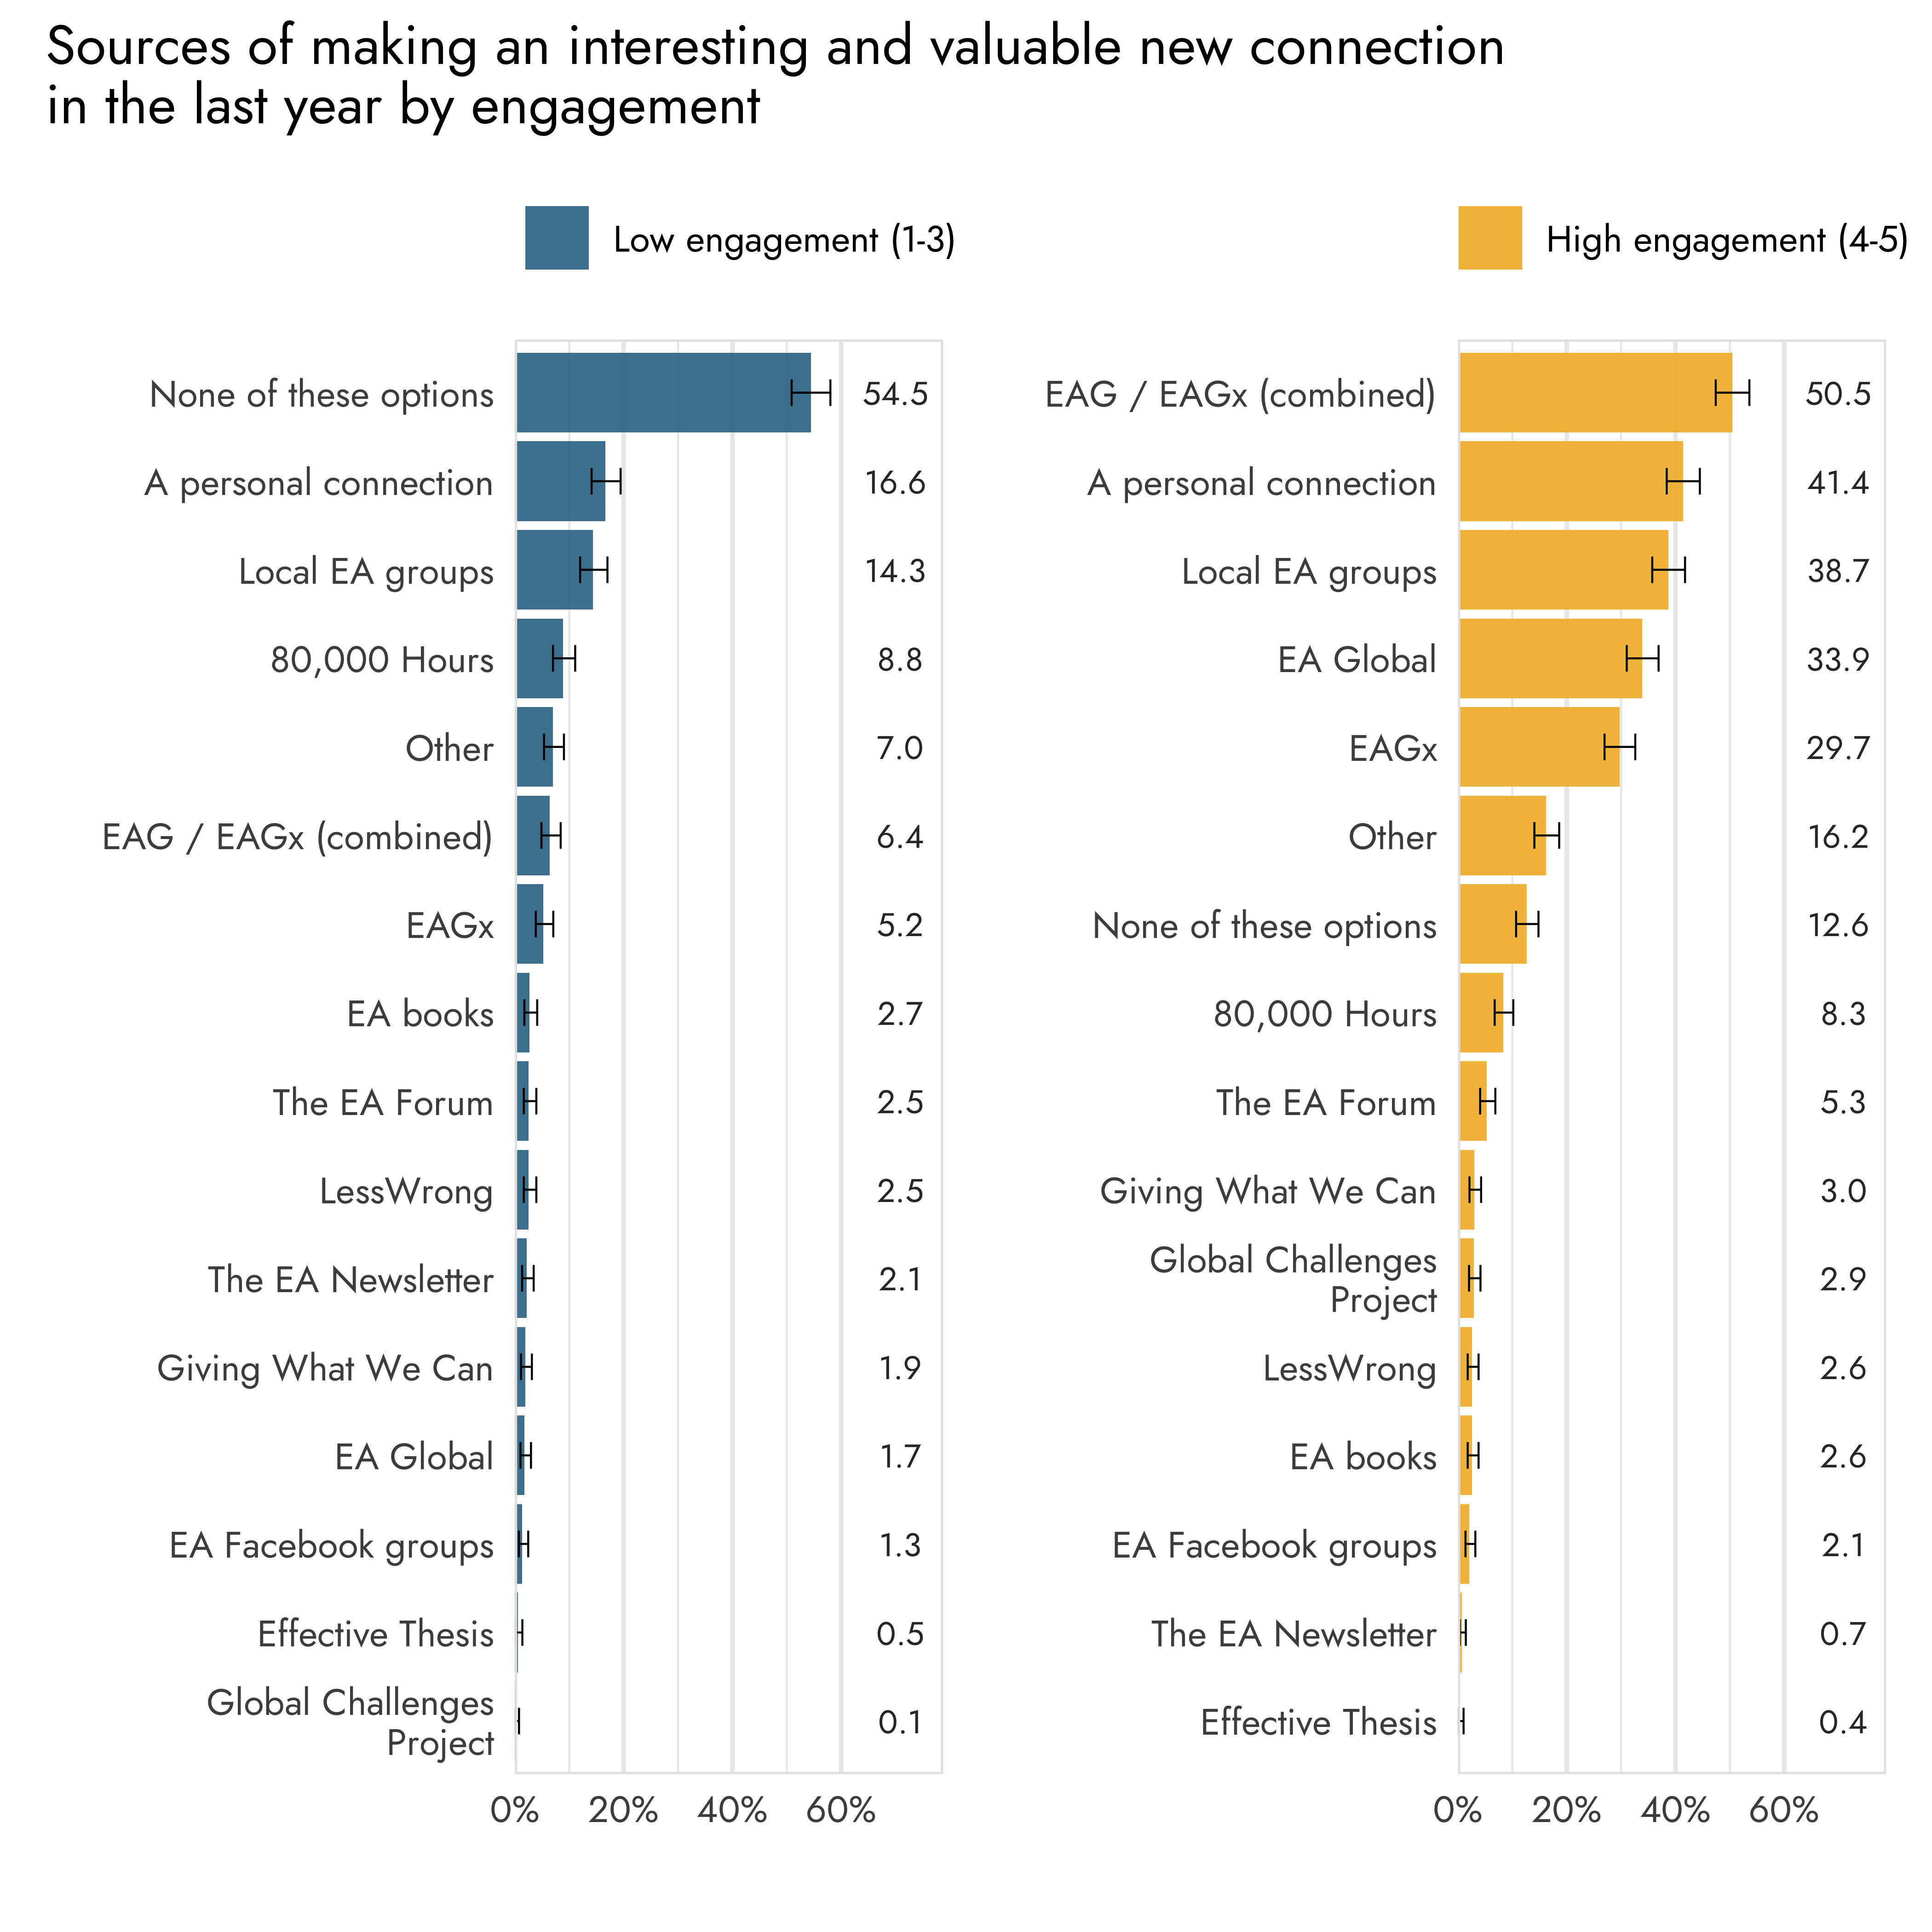
Looking at the specific differences between sources, we see that highly engaged respondents were more likely to have selected EA Global (33.9% vs. 1.7%), a personal connection (41.4% vs. 16.6%), EAGx (29.7% vs. 5.2%), local groups (38.7% vs. 14.3%), the ‘Other’ category (16.2% vs. 7%), Global Challenges Project (2.9% vs. 0.1%), and the EA Forum (5.3% vs. 2.5%).
Less engaged respondents, on the other hand, were more likely to have selected the EA Newsletter (2.1% vs. 0.7%) and the ‘None of these options’ category (54.5% vs. 12.6%).

This post was written by David Moss and Willem Sleegers. We thank all of the survey respondents for taking the time to complete the survey, as well as Ula Zarosa and Oscar Delaney for their feedback on this post.
Rethink Priorities is a think-and-do tank dedicated to informing decisions made by high-impact organizations and funders across various cause areas. We invite you to explore our research database and stay updated on new work by subscribing to our newsletter.
Appendix
Appendix 1: Alternative year-over-year comparison of factors with the largest positive influence on personal ability to have an impact
Appendix 2: Alternative graph for influential factors by cohort
Appendix 3: Alternative graph for connection sources by cohort
- ^
The exact questions in each year were:
- 2020: Which of the following have had the largest influence on your personal ability to have a positive impact? (select up to three)
- 2022: Which of the following have, within the last 12 months, had the largest influence on your personal ability to have a positive impact? (Choose up to three options.)
- 2024: Which of the following have, within the last 12 months, had the largest positive influence on your personal ability to have an impact?
- ^
For a discussion on this regarding the changes between 2020 and 2022, see the 2022 post on these results.
- ^
The following categories were used to assess EA engagement:
- No engagement: I’ve heard of effective altruism, but do not engage with effective altruism content or ideas at all.
- Mild engagement: I’ve engaged with a few articles, videos, podcasts, discussions, and/or events on effective altruism (e.g., reading Doing Good Better or spending ~5 hours on the website of 80,000 Hours).
- Moderate engagement: I’ve engaged with multiple articles, videos, podcasts, discussions, and/or events on effective altruism (e.g., subscribing to the 80,000 Hours podcast or attending regular events at a local group). I sometimes consider the principles of effective altruism when I make decisions about my career or charitable donations.
- Considerable engagement: I’ve engaged extensively with effective altruism content (e.g., attending an EA Global conference, applying for career coaching, or organizing an EA meetup). I often consider the principles of effective altruism when I make decisions about my career or charitable donations.
- High engagement: I make heavy use of the principles of effective altruism when I make decisions about my career or charitable donations. I am heavily involved in the effective altruism community, perhaps helping to lead an EA group full time or working at an EA-aligned organization.
Categories 1 to 3 were combined into a single ‘Low engagement’ category and categories 4 and 5 were combined to form a ‘High engagement’ category.
As ever, really appreciate the work on this survey, thanks for putting it together!
Since 'personal connections' was again the most commonly cited positive influence, I wonder if it’d be valuable to start tracking 'perceived network closeness' (or something similar) over time?
Something like:
This could give organisers and community builders a simple way to monitor how interconnected the community is - and whether that’s improving year to year. Ideally, this would be broken down region-by-region, so we could see which regions are performing particularly well.
In a perfect world, I'd love a measure of 'impact-mobility', but I'm not sure where the data would come from - maybe swapcard?
Thanks James!
We previously asked this question in 2019. The modal response was 0 such connections, followed by 1-2, though there was a long tail of >10 connection respondents. Connections were also far higher for highly engaged EAs (60.7% of highly engaged EAs had >10 connections, compared to 13.7% for considerably (4/5) engaged EAs, and <2% for anyone less engaged).
We cut the question due to lack of space and it not being prioritized by core orgs making requests of us. But we'd be happy to reintroduce if there is sufficient interest.
Ah, I thought you might’ve asked this before! Thanks for the link.
If anyone reading this has a say in future surveys, for what it’s worth, I’d be keen to see this question included.
Why? Because I think there’s a lot of value in aiming to grow community capital - basically, individual career capital times coordination ability. A measure of connectedness could give a useful signal about how well we’re doing on the coordination side.
Thanks James! Yes, we'd encourage any readers to flag what questions they would find most useful.
Executive summary: This evidence-based analysis from the 2024 EA Survey explores which factors most help people have a positive impact and form valuable personal connections in the EA community, finding that personal contact, 80,000 Hours resources, and EA events are consistently influential—though engagement level, gender, and racial/ethnic identity shape which sources matter most.
Key points:
This comment was auto-generated by the EA Forum Team. Feel free to point out issues with this summary by replying to the comment, and contact us if you have feedback.