James Özden and Sam Glover at Social Change Lab wrote a literature review on protest outcomes[1] as part of a broader investigation[2] on protest effectiveness. The report covers multiple lines of evidence and addresses many relevant questions, but does not say much about the methodological quality of the research. So that's what I'm going to do today.
I reviewed the evidence on protest outcomes, focusing only on the highest-quality research, to answer two questions:
- Do protests work?
- Are Social Change Lab's conclusions consistent with the highest-quality evidence?
Here's what I found:
Do protests work? Highly likely (credence: 90%) in certain contexts, although it's unclear how well the results generalize. [More]
Are Social Change Lab's conclusions consistent with the highest-quality evidence? Yes—the report's core claims are well-supported, although it overstates the strength of some of the evidence. [More]
Cross-posted from my website.
Introduction
This article serves two purposes: First, it analyzes the evidence on protest outcomes. Second, it critically reviews the Social Change Lab literature review.
Social Change Lab is not the only group that has reviewed protest effectiveness. I was able to find four literature reviews:
- Animal Charity Evaluators (2018), Protest Intervention Report.
- Orazani et al. (2021), Social movement strategy (nonviolent vs. violent) and the garnering of third-party support: A meta-analysis.
- Social Change Lab – Ozden & Glover (2022), Literature Review: Protest Outcomes.
- Shuman et al. (2024), When Are Social Protests Effective?
The Animal Charity Evaluators review did not include many studies, and did not cite any natural experiments (only one had been published as of 2018).
Orazani et al. (2021)[3] is a nice meta-analysis—it finds that when you show people news articles about nonviolent protests, they are more likely to express support for the protesters' cause. But what people say in a lab setting might not carry over to real-life behavior.
I read through Shuman et al. (2024). Compared to Ozden & Glover (2022), it cited weaker evidence and made a larger number of claims with thinner support.
I looked through these literature reviews to find relevant studies. The Social Change Lab review was by far the most useful; the other reviews didn't include any additional studies meeting my criteria. I used ChatGPT Deep Research[4] to find more publications.
I focused my critical analysis on only the highest-quality evidence:
- I did not review lab experiments. The Orazani et al. meta-analysis is informative, but it might not generalize to the real world.
- There are many studies showing an association between protests and real-world outcomes (voting patterns, government policy, corporate behavior, etc.), but the vast majority of them are observational.
Observational studies cannot establish causation. They cannot distinguish between "protests raised support for the cause" and "protests happened because people supported the cause". No amount of controlling for confounders fixes this problem.
Therefore, my review focuses only on natural experiments that measure real-world outcomes.
Conflict of interest: In 2024 I donated to PauseAI US, which organizes protests. I would prefer to find that protests work.
Studies on real-world protest outcomes
Social Change Lab reviewed five studies on how protests affect voter behavior, which they judged to be the best studies on the subject.
I excluded two of the five studies due to methodological concerns:
- McVeigh et al. (2014)[5] is an observational study that looked at long-term changes in Republican voting in counties where the Ku Klux Klan was most active.
- Bremer et al. (2020)[6] is a study on the correlation between protests and electoral outcomes in European countries.
I did not review these because they are observational studies, and I wanted to focus on natural experiments.
I did review the other three studies:
- Madestam, A., Shoag, D., Veuger, S., & Yanagizawa-Drott, D. (2013). Do Political Protests Matter? Evidence from the Tea Party Movement.
- Wasow, O. (2020). Agenda Seeding: How 1960s Black Protests Moved Elites, Public Opinion and Voting.
- Klein Teeselink, B. K., & Melios, G. (2021). Weather to Protest: The Effect of Black Lives Matter Protests on the 2020 Presidential Election.
In addition, I looked at two studies that the Social Change Lab report did not cover:
- Larreboure, M., & Gonzalez, F. (2021). The Impact of the Women’s March on the U.S. House Election.
- Hungerman, D., & Moorthy, V. (2023). Every Day Is Earth Day: Evidence on the Long-Term Impact of Environmental Activism.
There are no randomized controlled trials on the real-world effect of protests (how would you randomly assign protests to occur?). But there are five natural experiments—three from the Social Change Lab review, plus the Women's March and Earth Day studies. Most of the natural experiments use the rainfall method.
The idea is that protests often get canceled when it rains. If you look at voting patterns in places where rained on protest day compared to where it didn't rain, you should be able to isolate the causal effect of protests. The rain effectively randomizes where protests occur.
Rather than using rainfall directly, the rainfall method uses rainfall shocks—that is, unexpectedly high or low rainfall relative to what was expected for that location and date. This avoids any confounding effect of average rainfall levels.
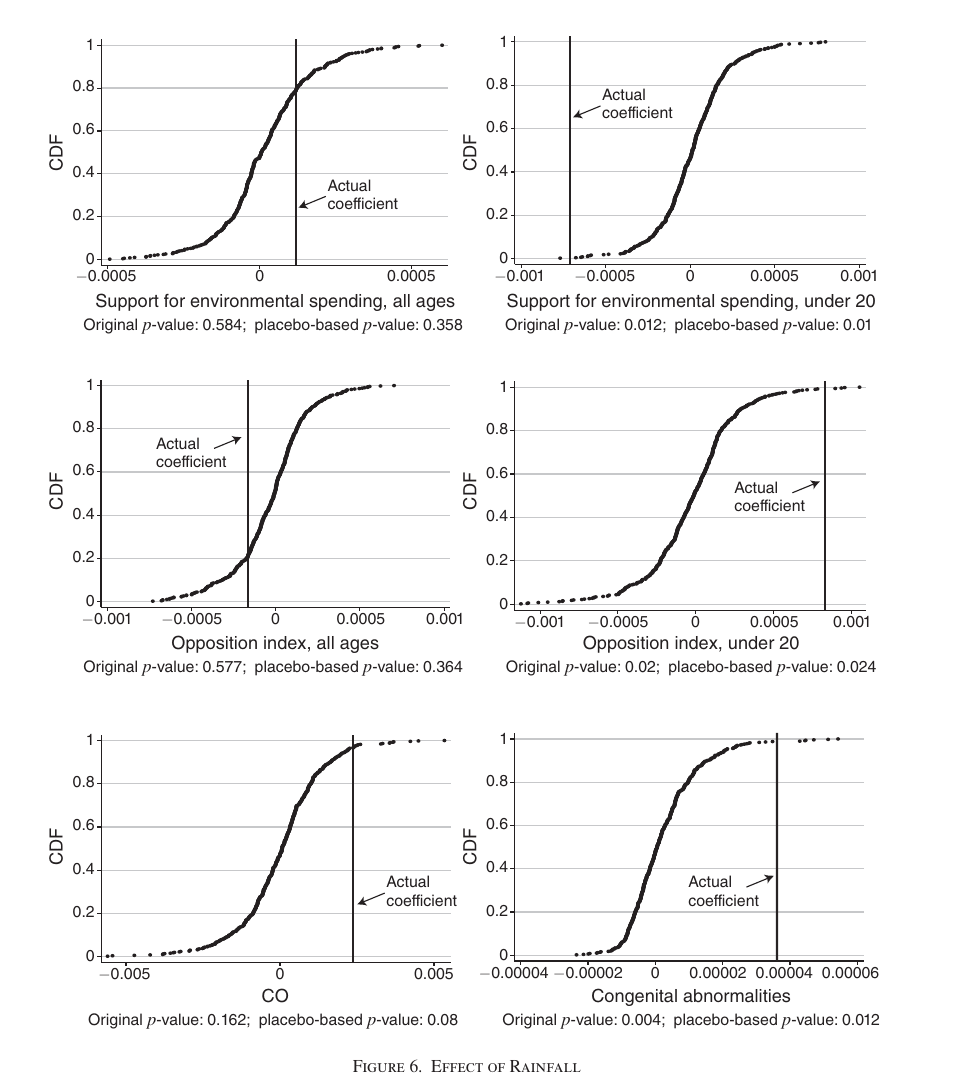
The clearest illustration of the rainfall method comes from Hungerman & Moorthy (2023)[7] (which I will discuss in more detail later). The authors looked at counties where it rained vs. didn't rain on the inaugural Earth Day—April 22, 1970. Then they used rainfall to predict the rate of birth defects from 1980–1988.The hypothesis is that Earth Day demonstrations increased support for environmental protections. That in turn would reduce environmental contaminants, leading to fewer birth defects. And if rainfall stops demonstrations from happening, then it will have the opposite effect.
The rainfall method is commonly used in social science, and it has received some fair criticism.[8][9] But the rainfall method as it was used by Hungerman & Moorthy is robust to these criticisms, as illustrated by this chart:
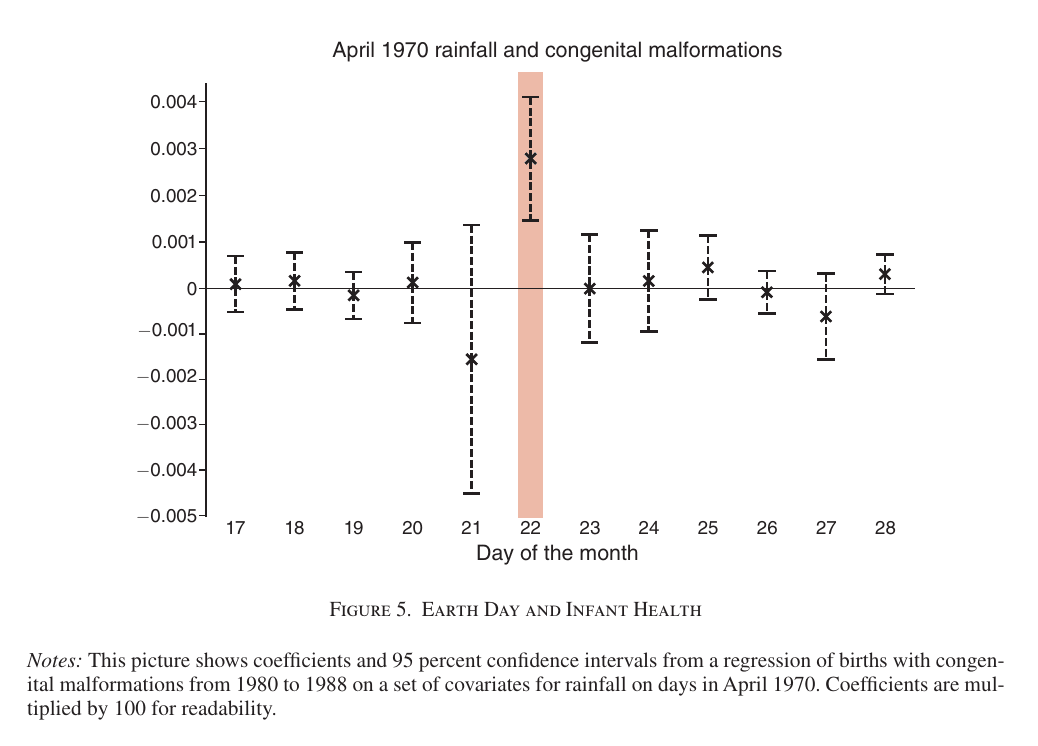
The key to establishing causation is that rainfall had no predictive power on any other day. It only mattered on Earth Day.
That leaves us with two possibilities:
- Rainfall is associated with higher birth defects due to some confounding variable, but only rainfall on April 22 and not on any other day, because that day is special somehow, in a way that has nothing to do with Earth Day; or
- Earth Day demonstrations reduced the rate of birth defects.
(Or the results could be due to a statistical error or data manipulation. I will discuss those possibilities later.)
A summary of the five studies I reviewed plus the two I declined to review:
Table 1: Summary of Studies
| Study | Protest | Protest Type | Effect | Randomization Method | Quality |
|---|---|---|---|---|---|
| Madestam et al.[10] | Tea Party | nonviolent | + | rainfall | high |
| Wasow[11] | Civil Rights | violent | - | rainfall | medium |
| Wasow[11:1] | Civil Rights | nonviolent | + | none (observational) | low |
| Klein Teeselink & Melios[12] | BLM | nonviolent | + | rainfall | high |
| Larreboure & González[13] | Women's March | nonviolent | + | weather shocks | medium |
| Hungerman & Moorthy[7:1] | Earth Day | nonviolent | + | rainfall | high |
| McVeigh et al.[5:1] | KKK activity | unclear | + | none (observational) | low |
| Bremer et al.[6:1] | Europe elections | nonviolent | ?[14] | none (observational) | low |
(Methodological quality is relative. I'd have higher confidence in a true experiment than in any of these quasi-experimental methods.)
Next I will review each study individually. Then I will collect the results into a meta-analysis.
Madestam et al. (2013) on Tea Party protests
Madestam et al. (2013)[10:1] looked at the effect of 2009 Tea Party protests on the 2012 US elections. It used the rainfall method to establish causality.
As an additional check, the authors tested whether rainfall could predict Republican and Democratic vote shares in the 2008 election. (You may recall that the 2009 Tea Party protests did not occur until a year after the 2008 election.) If rainfall can predict the 2008 election results—before the protests occurred—that means the model was confounded.
Madestam et al. (2013) found that rainfall in 2009 could not predict votes in 2008 (see Table II), but it could predict votes in 2012 (see Table VI).
The authors also tested whether rainfall on other days prior to the Tea Party protests could predict 2009 voting patterns, and found that they could not.
In the authors' model, a rainy protest decreased Republicans' share of the vote in the 2012 election by 1.04 percentage points (p < 0.0006[15]). This suggests that protests did indeed increase the Republican vote share.
Interestingly, rainfall decreased Republican vote share relative to the total population, but did not increase the Democratic share. This suggests that protests increased voter turnout but did not cause voters to change their minds.
At first I thought the inability to predict 2008 votes might be a false negative (like a p = 0.06 situation), but this was not the case. Rainfall in 2009 increased Republicans' vote share in 2008, although only slightly (p = 0.38). (Remember that rainfall is supposed to decrease Republican votes by preventing Tea Party protests from happening.)
There is another concern with the rainfall model—not with causality, but with overstating the strength of evidence. A standard statistical model assumes that all observations are independent. But rainfall is spatially autocorrelated, which is the statistical way of saying that rain in one county is not independent of rainfall in the neighboring counties. If you have data from 2,758 counties, you can't treat them as 2,758 independent samples.
Madestam et al. (2013) used several methods to account for this. First, it clustered standard errors at the state level instead of at the county level. Second, as a robustness check, the authors assumed spatial correlations varied as an inverse function of distance, which produced similar standard errors. Third, the authors tried dropping states one at a time to see if any states overly influenced the results.
Placebo tests
Finally:
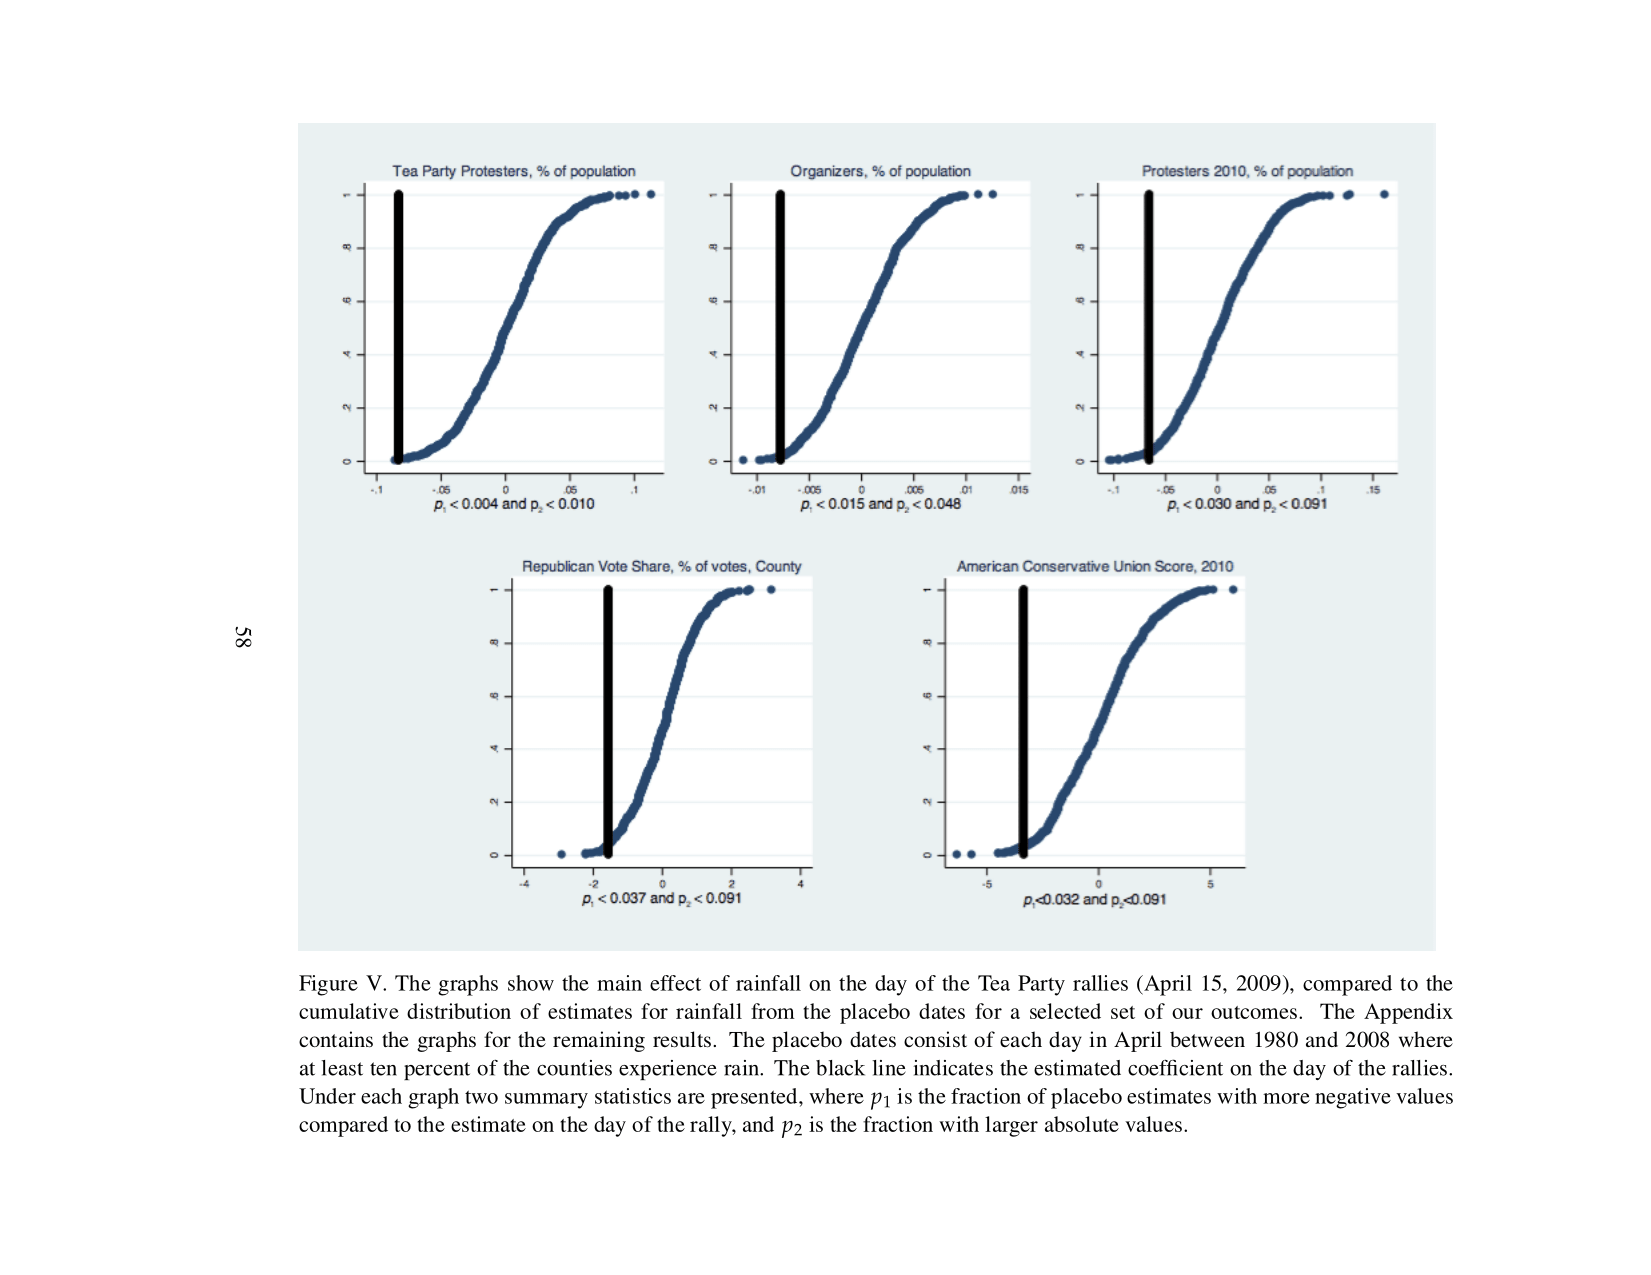
[W]e conduct a series of placebo tests using rainfall on other historical dates in April. These placebos are drawn from the same spatially correlated distribution as rainfall on April 15, 2009. If rainfall on the protest day has a causal effect, the actual estimate of rainfall ought to be an outlier in the distribution of placebo coefficients.
They calculated the "placebo p-value" as the probability that rainfall on a random day could predict outcomes better than rainfall on protest day. If the model has correctly accounted for spatial autocorrelation then the placebo p-value should equal the original model p-value, plus or minus some random variation.
The authors run tests on 627 random "placebo dates", and find that rain on protest day had a larger effect size than almost any of the placebo dates (see Figure V). This suggests that their corrections for spatial correlation worked, making false positives unlikely. However, the p-values on Figure V were a bit higher than the p-values in the main text, suggesting some effect size inflation due to spatial autocorrelation.
Wasow (2020) on 1960s civil rights protests
Wasow (2020)[11:2] measured the effect of nonviolent protests using observational data only. I won't discuss that portion of the paper.
Wasow applied the quasi-experimental rainfall model to violent protests and found that they had a significant backfire effect. I won't focus on the evidence on violent protests because I would recommend against engaging in violence regardless of what result the study found.
But if violent protests decrease public support, that's (weak) evidence against protests working in general. The simplest hypothesis is "protests work". But evidence on violent protests contradicts this, requiring a more complex claim: "nonviolent protests work, violent protests backfire". I will evaluate this two-part hypothesis in the meta-analysis below.
As some additional evidence on violent protests, Collins & Margo (2007)[16] used the rainfall method to find that 1960s riots decreased nearby property values. This is consistent with the finding from Wasow (2020) that violent protests backfire, but property values are not directly relevant to protesters' outcomes. It's conceivable that protests could simultaneously decrease local property values and increase public support.
Replication data from Wasow (2020) is publicly available.
Klein Teeselink & Melios (2021) on 2020 Black Lives Matter protests
Klein Teeselink & Melios (2021)[12:1] used the rainfall method to establish the effect of Black Lives Matter protests on the 2020 presidential election.
Unlike Madestam et al. (2013), this paper did not test whether rainfall could predict outcomes before the protests (which would indicate confounding).
As with Madestam et al. (2013), the authors of this paper considered the fact that rainfall is not independent across counties. Their model adjusts for this by including independent variables to represent the change in vote shares in surrounding counties, scaled by inverse distance.
Unlike the other studies in this review, Klein Teeselink & Melios (2021) treated county vote changes as interdependent. Their model assumes that the change in vote share in one county is partially explained by vote changes in the nearby counties, using the method described by Beck et al. (2006)[17].
Klein Teeselink & Melios' model isolates the impact of local protests on local vote change. In the method of (e.g.) Madestam et al. (2013), some vote changes may be explained by protests in neighboring counties. Klein Teeselink & Melios' method is more rigorous in a sense, but we don't actually want to isolate local changes. We want to know how well protests work overall, not just their local effects.
Klein Teeselink & Melios performed a robustness check in Table A3, Panel D where they fully ignored spatial autocorrelation. This produced mean effects more in line with the other studies: a vote share change of 11.9 per protester (std err 2.9), and a change of 0.105 based on the probability of rain (std err 0.032).
If you ignore spatial autocorrelation, you may overestimate the strength of evidence. However, in this case, ignoring spatial autocorrelation had only a modest impact on the t-stats:
| Primary Model | Ignoring Spatial Autocorrelation | Ignoring Spatial Autocorrelation + Counties Weighted by Population | |
|---|---|---|---|
| Vote Share Per Protester | 5.5 | 4.1 | 7.2 |
| Vote Share by Rain Probability | 2.3 | 3.3 | 9.3 |
The paper's replication data is publicly available.
Failed placebo tests
Earlier, I discussed how Madestam et al. (2013) performed "placebo tests" to check that its model wouldn't generate too many false positives. Klein Teeselink & Melios (2021) did the same, although with only nine placebo tests instead of 627:
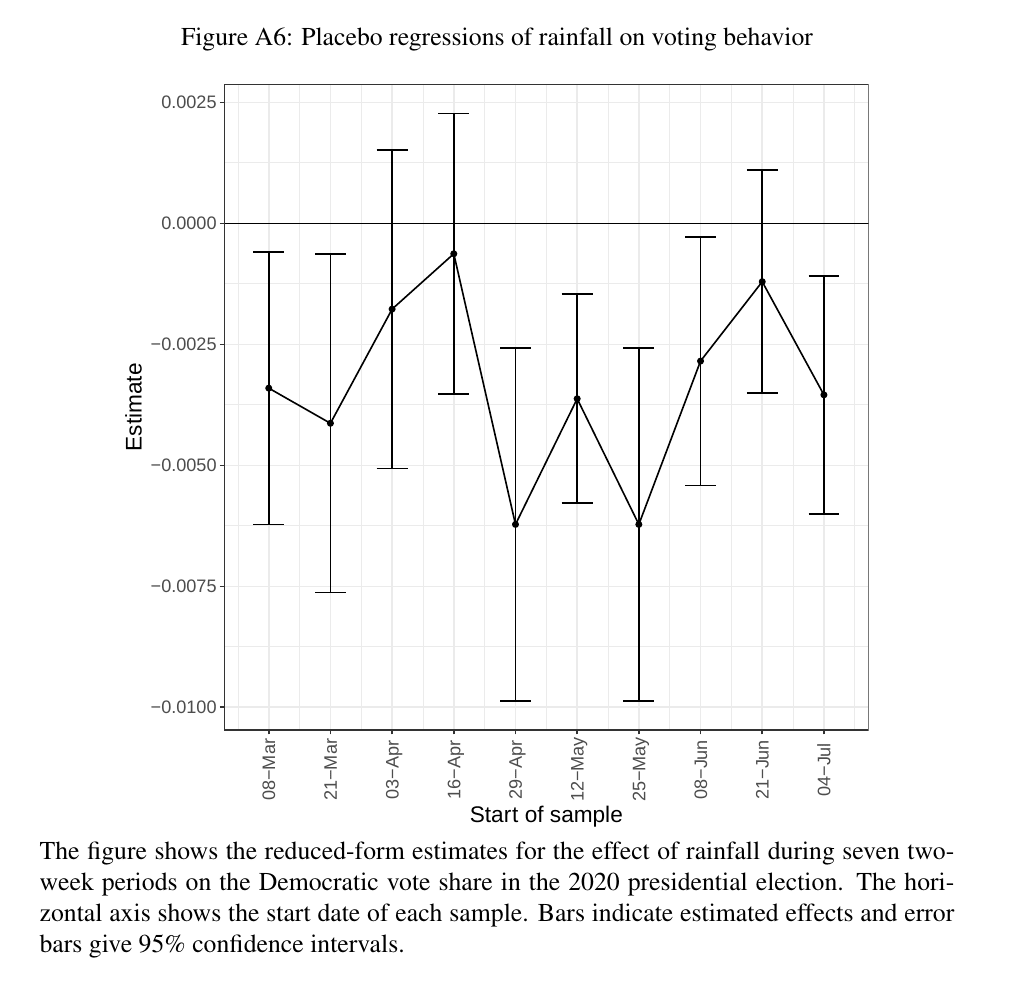
(May 25 was the beginning of the period in which the majority of protests happened.)
This chart shows that Klein Teeselink & Melios' version of the rainfall method did not establish causality. The fortnight of April 29—a month before the protests started—showed nearly the same effect size as the May 25 period, and 6 out of 9 placebo periods had p-values less than 0.05. So either some confounding variable explains the association between protests and vote share, or the standard error is underestimated due to spatial autocorrelation (or something similar).
The authors write
part of this association may be caused by serial correlation in weather patterns
In other words, a rainy June often also means a rainy April or May, so rain in April/May might appear to affect protest outcomes because it's correlated with rain in June. (And thus the model does establish causality.)
That may be true, but I'm not confident in that explanation,[18] and therefore I can't trust this model to establish causality. Therefore, I exclude the BLM protests from my meta-analysis.
(But this does leave me wondering: How is it that rainfall shocks in April could predict vote changes in the 2020 presidential election?)
It would be interesting to compare the publicly-available BLM data to the Earth Day data (see below) to figure out why the Earth Day paper passed its placebo test but BLM did not. But that's beyond the scope of this article.
Larreboure & González (2021) on the Women's March
Larreboure & González (2021)[13:1] attempted to use the rainfall method to predict whether the 2017 Women's March affected how many votes went to woman candidates in the 2018 election. I say "attempted" because they found that rainfall did not predict Women's March attendance. So instead, they used "weather shocks" to predict voting outcomes. These shocks were defined as a combination of weather-related factors that they chose using a LASSO[19] regression model.
I see no obvious problem with the "weather shocks" method, but I'm wary of adding more mathematical complexity. Complexity makes flaws harder to spot.
Larreboure & González found that protests increased voter turnout and vote share to women for both Democratic and Republican candidates.
The authors accounted for spatial autocorrelation by clustering standard errors at the state level. They included a robustness check where they adjusted for spatial autocorrelation using the method from Conley (1999)[20] with two different distance cutoffs, 50 km and 100 km (in Table A.8).
This paper had at least two inconsistencies in its reported figures:
- Page 13 says an additional 1% of the population protesting increased vote share for women and under-represented groups by 12.95 percentage points (pp). However, Table 4 on page 28 reports an increase of 12.70 pp.[21]
- A more minor error, but page 13 says the 12.95 pp number is "remarkably similar to the impact of the Tea Party protesters on the vote share of the Republican Party (i.e. 12.59)". However, the 12.59 number from Madestam et al. (see above) is the change in absolute votes, not vote share. The reported change in vote share was 18.81, which is not remarkably similar to 12.95.
I will take the 12.70 number reported in Table 4 as correct (it is repeated again in the robustness checks).
To be conservative, in my meta-analysis I will use the figures from the 50 km robustness check (where available) because they had the largest standard errors.
Hungerman & Moorthy (2023) on Earth Day
Hungerman & Moorthy (2023)[7:2] found that rainfall on the inaugural Earth Day, April 22, 1970, could predict people's environmental attitudes on surveys from 1977 to 1993.
It also directly measured environmental impact by looking at pollutant levels and rates of birth defects (which can result from exposure to environmental contaminants). It found that rainfall on Earth Day could predict birth defects.
The paper claims that rainfall predicted carbon monoxide levels, and it did find a statistically significant change. However, Appendix Table A3 examines five environmental contaminants, of which only carbon monoxide had a t-stat above 2, and two out of five outcomes were (slightly) negative. The positive effect on carbon monoxide may be a false positive.
Earlier I showed this chart:
The chart shows that rainfall on April 22, 1970–Earth Day—predicts the rate of birth defects 10 years later, but rainfall on any other day does not.
The same chart for the effect of rainfall on support for environmental spending:
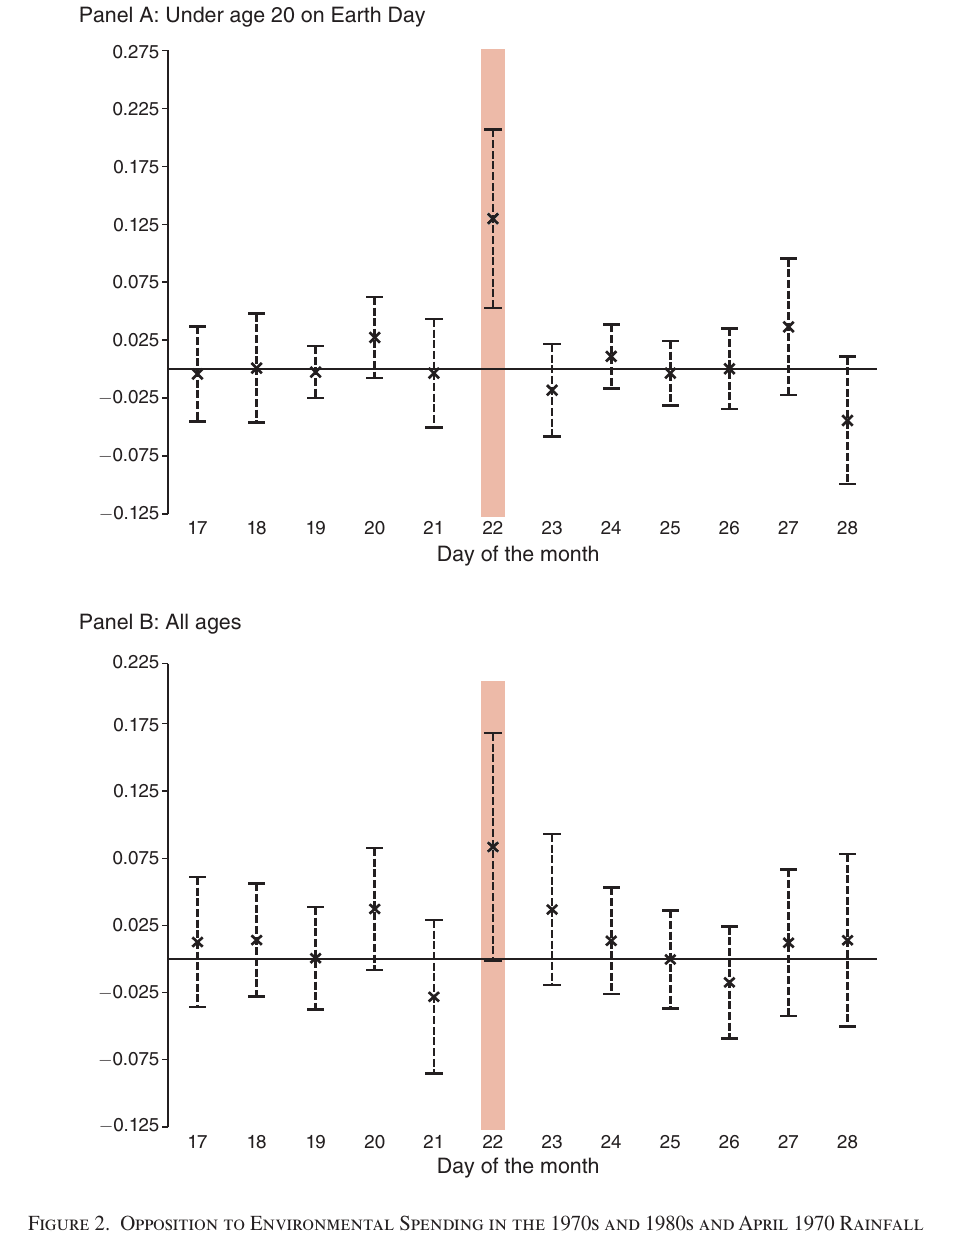
The paper addresses the previously-mentioned spatial autocorrelation problem using the same techniques as Madestam et al. (2013). If spatial autocorrelation were distorting the effect sizes, we would expect to see more spurious statistically significant outcomes on the charts above. But we only see large effect sizes on Earth Day, not on any other day, which indicates that spatial autocorrelation is not a problem.
Like Madestam et al. (2013), the authors generated hundreds of additional "placebo tests" (as described above) where they looked at how well rainfall on different random days could predict environmental outcomes. They found that the placebo p-values were very similar to the original p-values (and even lower in some cases):
The paper's source code and data are publicly available.
Meta-analysis
For two of the five natural experiments, I calculated expected change in number of votes for each additional protester, or change in vote share per protester (defined as votes per protester divided by turnout):
Table 2: Change in Votes Per Protester
| Protest | Votes | Std Err | Vote Share | Std Err | n | Source |
|---|---|---|---|---|---|---|
| Tea Party | 12.59 | 4.21 | 18.81 | 7.85 | 2758 | Table VI |
| Women's March | 3* | ** | 9.62 | 4.47 | 2936 | Table A.8 and page 3 |
*only one significant figure was provided
**not reported
I did not include the Earth Day or Civil Rights protests because the studies did not provide the relevant data.[22] The BLM study reported vote share per protester, but I excluded it due to the study's failure to establish causality, discussed previously.
I aggregated the results by applying a random-effects model. According to these two studies, protests have a mean impact of +11.95 vote share per protester (standard error 4.00; likelihood ratio 87.1; p < 0.003).
(The likelihood ratio tells us how much evidence the data provides. A likelihood ratio of 10.3 means that, assuming the study's methodology is perfect, the odds of getting this result are 10.3x higher if the true mean is 7.84 than if the true mean is 0.)
If we are considering supporting some upcoming protest, we might want to estimate the probability that it will backfire. One way to do that is by using the pooled sample of past protests.
This pooled sample has a between-study standard deviation of 1.19, which reflects how much the effectiveness of protests varied across the studies. If we assume that the sample's mean and between-study variation are exactly correct (which is questionable, since the pool only includes two studies), then we can model protest outcomes as a normal distribution with a mean of 11.95 and a standard deviation of 1.19.
Under this model, the probability of a protest having a negative effect—i.e., producing a value less than zero—is extremely small. But I would not take these precise numbers too seriously.
Vote share per protester is the most interesting metric for my purposes because it gives information about cost-effectiveness—it tells you how much impact you can expect for each marginal protester. But the natural experiments reported on other outcomes as well, such as overall change in vote share (as determined by changes in rainfall) and popular support for protesters' objectives.
I applied a random-effects model to aggregate a few different sets of outcomes:
Table 3: Pooled Sample Outcomes
| Outcomes | Mean | Std Err | likelihood ratio | p-value | P(negative effect) |
|---|---|---|---|---|---|
| Vote Share Per Protester | 11.95 | 4.00 | 87.1 | 0.003 | 0 |
| Vote Share | 1.59 | 0.48 | 257 | 0.001 | 0.002 |
| Vote Share (Rain Only) | 1.14 | 0.42 | 39.3 | 0.007 | 0 |
| Single Hypothesis | 1.06 | 0.78 | 2.55 | 0.172 | 0.199 |
| Favorability | 2.68 | 2.32 | 1.95 | 0.249 | 0.176 |
- Row 1 – Vote Share Per Protester uses the pooled outcome that I described in Table 2, including Tea Party and Women's March vote share per protester.
- Row 2 – Vote Share takes these outcomes from the studies on nonviolent protests:
- Tea Party – Republican vote share
- Women's March – women's vote share
- Earth Day – favorability (1)[23] as a proxy for vote share
- Row 3 – Vote Share (Rain Only) uses the same outcomes as Row 2, but excluding the Women's March outcome because it used weather shocks rather than rainfall.
- Row 4 – Single Hypothesis does not differentiate between nonviolent and violent protests, instead lumping all studies together. It includes the three Vote Share measures from Row 2, plus Civil Rights – vote share.
- Row 5 – Favorability includes measured changes in popular support for a protest's goals:
- Tea Party – support for the Tea Party
- Earth Day – favorability (1)[23:1]
(Note: P(negative effect) = 0 doesn't mean it's literally zero, but it's so small that it gets rounded off to zero.)
The Women's March and Earth Day papers used continuous rainfall variables instead of binary (rain vs. no rain); those papers' outcomes were standardized using the method from Gelman (2007)[24] to put them on the same scale as binary variables.[25]
The Vote Share Per Protester and Vote Share tests produce low p-values/high likelihood ratios, and under those models, nonviolent protests have virtually no chance of having a negative effect on support. Favorability has a weak likelihood ratio due to a large variance between outcomes.[26]
Under the Single Hypothesis model, protests have a much weaker p-value/likelihood ratio. Naturally, when you include a negative outcome, it pulls down the average effect quite a bit. The mean is still positive, which makes sense given that only one out of four included protests was violent.
Is it fair to separate out violent and nonviolent protests? I'm wary of adding complexity to a hypothesis but I believe it's justified in this case:
- It's intuitively plausible that peaceful protests would earn support while violence would backfire.
- Lab experiments[3:1] and observational studies support this bimodal hypothesis.
- I ran a t-test for the hypothesis that nonviolent and violent protests have the same effect on voting outcomes, comparing the pooled outcome from Row 2 – Vote Share against the Civil Rights protest outcome. The result had a likelihood ratio of 55.1 and p < 0.005. We can strongly reject the hypothesis that these two samples have the same mean.
There are some reasons believe these results may be overstated, which I will address under Potential problems with the research. There are also at least two reasons to believe they may be understated:
- Rainfall does not perfectly predict whether protests occur. (Sometimes people protest in the rain.) If protests genuinely work, then the effect of protests will be larger than the effect of protests as predicted by rainfall.
- I aggregated the most similar metrics into pooled outcomes. But these were not always the strongest metrics. For example, Earth Day protests strongly predicted birth defects (likelihood ratio 55,000; p < 3e-6). But I did not include birth defects in the meta-analysis because it did not have any comparable counterpart in the other studies.
Table 4 shows outcomes across the five studies, estimated by looking at counties where it rained vs. did not rain. The Women's March and Earth Day results are standardized as explained above.[25:1]
Table 4: Societal-Level Protest Outcomes
| Protest | Outcome | Change | Std Err | Source |
|---|---|---|---|---|
| Tea Party | votes (as % of population) | 1.04%** | 0.30% | Table VI |
| Tea Party | vote share | 1.55%* | 0.69% | Table VI |
| Tea Party | conservative vote score[27] | 1.922* | 0.937 | Table VII |
| Tea Party | average belief effect[28] | 0.13*** | 0.037 | Table V |
| Tea Party | strongly supports Tea Party | 5.7%* | 2.5% | Table V |
| Tea Party | Sarah Palin favorability | 5.7%* | 2.6% | Table V |
| Tea Party | "outraged about way things are going in country" | 4.6%* | 2.1% | Table V |
| Tea Party | opposes raising taxes on income >$250K | 5.8% | 3.0% | Table V |
| Tea Party | "Americans have less freedom than in 2008" | 6.5%* | 2.6% | Table V |
| Tea Party | Obama unfavorability | 4.6% | 2.4% | Table V |
| Civil Rights (violent) | vote share among white voters | –5.56%* | 2.48% | Appendix, Table 12 |
| BLM | vote share | 2.7% | 1.2% | Table 2 |
| BLM | "Blacks should not receive special favors" | –0.242[29] | 0.360 | Table 3 |
| BLM | "Slavery caused current disparities" | 0.339[29:1] | 0.388 | Table 3 |
| Women's March | women's vote share | 2.48%*** | 0.64% | Table 4 |
| Women's March | voter turnout | 0.41%** | 0.14% | Table 4 |
| Earth Day | favorability (1)[23:2] | 0.90% | 0.53% | Table 2 |
| Earth Day | favorability (1)[23:3] among under-20s | 1.67%** | 0.62% | Table 2 |
| Earth Day | favorability (2)[23:4] | 1.12 | 0.70 | Table 2 |
| Earth Day | favorability (2)[23:5] among under-20s | 1.90* | 0.82 | Table 2 |
| Earth Day | carbon monoxide | 0.07* | 0.03 | Table 4 |
| Earth Day | birth defects | 1.00*** | 0.21 | Table 4 |
*p < 0.05; **p < 0.01; ***p < 0.001
Potential problems with the research
Spatial autocorrelation
Recall that "spatial autocorrelation" is a technical way of saying "rainfall is not independent across counties". If you assume your samples are independent when they're not, your standard errors will be too low—giving you too much confidence in your results.
It's conceivable that all five studies overstated the strength of their results due to spatial autocorrelation.
Each study on nonviolent protests used at least some technique to correct for spatial autocorrelation. Madestam et al. (2013) and Hungerman & Moorthy (2023) included "placebo tests". The placebo tests from Madestam et al. (2013) indicated that these corrections mostly worked but did not fully succeed, whereas Hungerman & Moorthy's corrections apparently did succeed. On balance, this suggests that the standard errors of the pooled outcome may be understated, but probably not by a large margin.
Two of the pooled outcomes from Table 3—the Vote Share Per Protester and Favorability pools—had strong likelihood ratios / low p-values. That suggests they should hold up even with somewhat reduced statistical power.
Publication bias
The standard method to assess publication bias would be to make a funnel plot. I didn't do that for two reasons:
- With only five studies (at best), there aren't enough data points to detect publication bias even if it exists.
- A funnel plot only works if your studies cover a range of sample sizes. All the natural experiments have roughly the same sample size (because they all look at county-level data for the majority of US counties).
As an alternative, I tested how the results might change if we discovered some unpublished null results. I used the following procedure:
- Choose one of the pooled outcomes from Table 3.
- For each individual study outcome, clone it to create a "dummy null outcome" with the same standard error and sample size, but a mean of 0. This represents a hypothetical study that didn't get published because it found a null result.
- Construct a larger pooled sample using all four or six outcomes (the two or three real outcomes plus the two or three null dummies).
Table 5: Pooled Sample Effects, Adjusted for Publication Bias
| Outcomes | Mean | Std Err | likelihood ratio | p-value |
|---|---|---|---|---|
| Vote Share Per Protester | 6.43 | 4.01 | 3.61 | 0.11 |
| Vote Share | 0.80 | 0.41 | 6.97 | 0.049 |
| Vote Share (Rain Only) | 0.58 | 0.36 | 3.77 | 0.104 |
| Favorability | 0.74 | 0.65 | 1.91 | 0.256 |
Adding in null results considerably weakens the strength of evidence.
This approach is deliberately conservative. I wouldn't say this meta-analysis is robust to publication bias, but it's not particularly vulnerable to publication bias, either.
(The dummy-null approach leaves something to be desired. If the true mean were 6.43 as the pooled sample suggests, it would be surprising to see three positive results with low p-values plus three null results with equally tight standard errors. But I haven't thought of any better ideas for how to test publication bias.)
[Orazani et al. (2021)](https://mdickens.me/materials/Protest Meta-Analysis.pdf)[3:2] reviewed lab experiments on protest favorability. Among other things, it looked at publication bias. This paper might be informative, since it stands to reason that if experimental researchers on protests have a certain bias, then sociological researchers might have a similar bias.
The paper included a funnel plot:
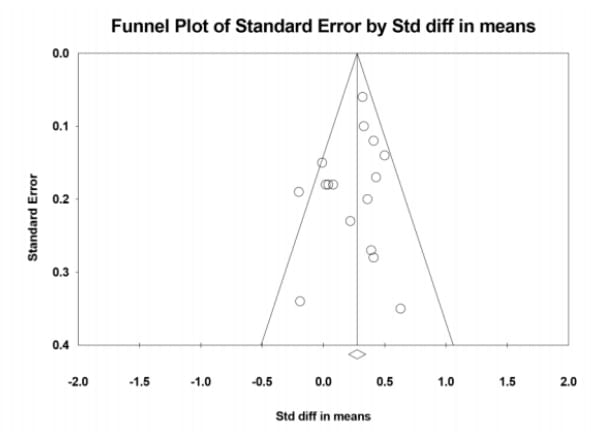
To supplement the plot, I tested for publication bias using two statistical tests:
- Egger's regression test[30] found r = 0.124, p < 0.646 (r > 0 means that more powerful studies had larger mean effects, which if anything is evidence of inverse publication bias).
- Kendall's tau test found p < 0.565.
Orazani et al. (2021) included 14 experiments and 2 non-experimental studies. I also tested for publication bias when excluding the non-experiments and again found highly insignificant p-values.
Orazani et al. (2021) tested for a difference between published and unpublished studies (although they defined "unpublished" in a way that seemed strange to me—they counted dissertations and conference presentations as unpublished). They found a significant difference in effect size, suggesting the presence of publication bias. Published studies had a Cohen's d of 0.39, versus 0.22 for unpublished studies. However, this difference disappeared when the authors controlled for certain features of the protests being studied (e.g. protests directed at the government as opposed to society). I am not sure what to make of this, but there is at least some evidence of publication bias.
Data fabrication
Most meta-analyses do not consider the possibility that some studies' data might be fabricated, and I believe they should. Checking for fraud is difficult in general, but I will do some basic checks.
When humans fabricate data, they often come up with numbers that don't look random. Real data should follow two observable patterns:
- The last digits of numbers should be uniformly distributed.
- The first digits of numbers should NOT be uniformly distributed. Instead, they should obey Benford's law.
I tested for suspicious patterns by collecting a list of statistical results (means and standard errors for various outcomes) from the BLM, Tea Party, Women's March, and Earth Day papers. I did not include the Civil Rights paper because its quasi-experimental data only included violent protests.
I also did a power check to determine whether the tests have adequate statistical power. We should be able to reject the hypotheses that the first digits follow a uniform distribution, and that the last digits follow Benford's law.
  Tea Party:
      First-digit Benford's Law p-value: 0.598
      Last-digit uniformity p-value:     0.306
      Power check p-values:              0.001, 0.002

  BLM:
      First-digit Benford's Law p-value: 0.438
      Last-digit uniformity p-value:     0.598
      Power check p-values:              0.001, 0.001

  Women's March:
      First-digit Benford's Law p-value: 0.181
      Last-digit uniformity p-value:     0.891
      Power check p-values:              0.001, 0.001

  Earth Day:
      First-digit Benford's Law p-value: 0.121
      Last-digit uniformity p-value:     0.224
      Power check p-values:              0.038, 0.001
(P-values are rounded up to 3 digits. See source code for full details.)
In all cases, I found high p-values for the first and last digits, which means the data follow the expected natural patterns. And I found very low p-values for the sanity check tests, which means the tests are sufficiently powerful (except for Earth Day first digits, where few independent outcomes were reported).
These tests do not rule out more sophisticated fraud. For example, if the authors generated false data and then calculated statistical tests on top of them, the fabricated results would still pass the first-digit and last-digit checks.
Data errors
Checking for data errors is difficult in general.[31] I did a basic consistency check to verify that each study's reported means and standard errors seemed internally consistent, but it's hard to see errors that way.
The only data error I noticed was in Larreboure & González (2021)[13:2]. As I mentioned before, it reported inconsistent numbers for the change in vote share based on each 1% of the population protesting: 12.95 pp (std err 5.63) on page 13 in the text, and 12.70 pp (std err 5.48) in Table 4.
The difference is small, which suggests the authors may have made some revision to their calculations but didn't update all the values reported in their manuscript. If so, the number in Table 4 is likely the correct one.[32]
This inconsistency suggests that the authors have some degrees of freedom for p-hacking, but the two numbers are similar enough to have minimal impact on the result of my meta-analysis.
Will the results generalize?
All the protests covered by natural experiments have certain commonalities:
- They all had a large number of participants.
- They were all nationwide (they had to be, so the study authors could use county-level data).
- They all took place in the United States.
Will the results generalize to other countries? Will the results generalize to smaller-scale or local protests?
The fact that these protests were so widespread means their objectives couldn't have been far outside the Overton window (i.e., the range of politically acceptable ideas at the time). Perhaps a protest that advocated for a more radical position would be more likely to backfire. To address this question, perhaps we could look at lab experiments on protests, but that's beyond the scope of this article.
Meta-concerns with this meta-analysis
I have some criticisms of my meta-analysis itself:
- I did not pre-register a methodology. I have limited experience conducting meta-analyses and I was learning as I wrote this article. Realistically, I would not have had the motivation to finish if I'd been required to fully determine a methodology in advance. But the platonic ideal of this meta-analysis would have included a pre-registration.
- Three of the studies (BLM, Civil Rights, and Earth Day) published their data. A thorough analysis would attempt to replicate those studies' findings. I did not do that.
Are Social Change Lab's claims justified?
Broad claims
Social Change Lab's literature review included a summary of findings, reproduced below.
">Table 6: Social Change Lab Findings
| Finding | Confidence |
|---|---|
| Protest movements can have significant short-term impacts | Strong |
| Protest movements can achieve intended outcomes in North America and Western Europe | Strong |
| Protest movements can have significant impacts (2-5% shifts) on voting behaviour and electoral outcomes | Medium |
| Protest movements can positively influence public opinion (≤10% shifts) | Medium |
| Protest movements can influence public discourse (e.g. issue salience and media narratives) | Medium |
| Protest movements can influence policy | Low (mixed evidence) |
| Protest movements can influence policymaker beliefs | Low (little evidence) |
| Protest movements can achieve desired outcomes in the Global South | Low (little evidence) |
| Protest movements can have significant long-term impacts (on public opinion and public discourse) | Low (little evidence) |
In this section, I assess whether the natural experiments support each "Strong" and "Medium" claim. I find that the evidence does indeed support the findings and I agree with Social Change Lab's confidence levels in each case.
I do not review the four "Low Confidence" claims because none of the natural experiments attempted to test them. (That fact itself suggests that "Low Confidence" is an accurate label.)
Starting with the findings rated "Strong":
Protest movements can have significant short-term impacts | Strong Protest movements can achieve intended outcomes in North America and Western Europe | Strong
The natural experiments support these claims. There's also supporting evidence from lab experiments on how protests affect people's perceptions; studies on media coverage; and observational data on protest outcomes. For a meta-analysis of lab experiments, which I view as the second-strongest form of evidence, see [Orazani et al. (2021)](https://mdickens.me/materials/Protest Meta-Analysis.pdf)[3:3].
I do not have much confidence in most of these lines of evidence, but the natural experiments offer good support:
- All study results point the same direction (as long as we exclude the data on violent protests).
- The pooled outcomes have high likelihood ratios / low p-values.
- There are no signs of data fabrication.
I'm still concerned about publication bias and spatial autocorrelation. I am not sure it is appropriate to describe the evidence as "Strong". It would be fair to downgrade your confidence to "Medium" based on these concerns. But I also think "Strong" confidence is defensible; the distinction depends on how much weight you give to the hard-to-quantify limitations with the existing evidence.
The natural experiments all cover nationwide, popular protests in the United States, so it's not clear that the results generalize. Regardless, Social Change Lab didn't claim that protests always have significant impacts, only that they "can" have impact; and the existence of these natural experiments shows that indeed they can.
The highest-quality studies are all natural experiments, not true experiments. A true experiment would be preferable. But the rainfall method seems sufficient to establish causality so I am comfortable treating these natural experiments' methodologies as valid.
Whether this evidence qualifies as "strong" is a matter of debate. Certainly the evidence could be much stronger. But I would be surprised if these findings were overturned, so I think Social Change Lab's confidence level is fair.
Protest movements can have significant impacts (2-5% shifts) on voting behaviour and electoral outcomes | Medium
A 2–5% shift is consistent with the natural experiments, which found changes in vote share ranging from 1.55% to 5.54% (see Table 4). I think 2–5% is fair as an optimistic expectation, given that the natural experiments all covered large nationwide protests.
I believe the rainfall method is effective at establishing causality, but we can't be too confident in the magnitude of the effect because rainfall does not perfectly predict protest attendance. So I would not rate the confidence for this finding as higher than "Medium".
Protest movements can positively influence public opinion (≤10% shifts) | Medium
Among the natural experiments, only two (Madestam et al. 2013; Hungerman & Moorthy 2023) reported on public opinion in terms of percentages. Public opinion changes clustered around 5% for the multiple measures in the two studies.
Klein Teeselink & Melios (2021) reported changes in public opinion on a 5-point scale. Rainfall predicted changes of 0.242 and 0.339 on two different questions, which correspond to percentage changes of about 6% and 8.5%, although the interpretation of these percentages isn't the same as for the other two studies.
I believe the data on voter behavior also provides evidence on public opinion—if you vote differently, it's most likely because your opinion changed.
So I think Social Change Lab's finding is indeed moderately well supported.
Protest movements can influence public discourse (e.g. issue salience and media narratives) | Medium
None of the natural experiments directly addressed this claim.[33]
Several observational studies found that protests frequently get media coverage. Even though the studies are all observational, I am comfortable inferring causality in this case—it seems odd to say that protests occurred, the news covered the protests, but the protests did not cause the news coverage.
Claims about individual studies
The literature review discussed five studies on real-world impacts of protests. Did it represent the studies accurately?
Social Change Lab discussed the observational component of Wasow (2020)[11:3] but not the quasi-experimental component.
By looking at US counties that are similar on a number of dimensions (black population, foreign-born population, whether the county is urban/rural, etc.), Wasow is able to mimic an experiment by testing how the Democratic vote share changes in counties with protests and matching counties without protests.
I don't think it's reasonable to say that a matched observational design "mimic[s] an experiment". It could be that protests were more likely to happen in counties that were already shifting Democratic; you can't prove that the protests caused the shift.
I agree with everything Social Change Lab wrote about Madestam (2013)[10:2].
Regarding Klein Teeselink & Melios (2021)[12:2], the literature review wrote:
[A] one percentage point increase in the fraction of the population going out to protest increased the Democratic vote share in that county by 5.6 percentage points[.]
First, this figure is incorrect: it should be 3.3 percentage points (page 11). Klein Teeselink & Melios (2021) was revised in 2025 and I only have access to the latest revision, so it's possible that Social Change Lab's figure comes from the 2021 version.
Second, Klein Teeselink & Melios' placebo tests show that the natural experiment failed to establish causality. Social Change Lab interprets the study's outcome as causal, but I do not believe this interpretation is justified.
Social Change Lab's description of McVeigh, Cunningham & Farrell (2014)[5:2] was fair; it was appropriately cautious about the weakness of the paper's evidence.
On Bremer et al. (2019)[6:2]:
They found that whilst no such relationship existed for all 30 countries, in Western Europe did [sic] find a statistically significant interaction between protest, levels of economic hardship in a country and the loss of votes for the incumbent party.
I'm suspicious of p-hacking when a study finds a non-significant main result and a significant sub-group result. I wish Social change Lab had been more skeptical of Bremer et al.'s approach.
It seems that for a given level of economic hardship a country faces, if the number of protests increase, the incumbent political party will lose more votes[.]
This quote implies causality, which was not established—the Bremer et al. study was purely observational.
In summary, Social Change Lab overstated the strength of evidence several times when reviewing particular studies. However, I believe their summary findings are still accurate, partially thanks to the two additional natural experiments (Larreboure & González (2021)[13:3] and Hungerman & Moorthy (2023)[^36) that came out more recently.
Conclusion
My position on the Social Change Lab literature review:
- The review was insufficiently skeptical about weak evidence, and too willing to attribute causality where it had not been established.
- The review's summary claims about the overall strength of evidence were consistent with my assessments. Perhaps the "Strong Confidence" findings were overconfident and should be "Medium Confidence" instead, but I can see arguments either way.
Conducting a meta-analysis changed my view on protest effectiveness. My previous stance was that protests probably work, and that various lines of evidence pointed that way, but that all available evidence was weak. I now believe that some of the evidence is relatively[34] strong, and I am more confident that protests work.
Source code
Source code for my meta-analysis is available on GitHub.
Appendix A: Additional tables
Most meta-analyses report study heterogeneity (I<sup>2</sup>). I reported P(negative effect) instead, which provides equivalent information, and I believe it's more useful in this case. For completeness, Table A.1 gives the I<sup>2</sup> values for Table 3.
Table A.1: Pooled Outcomes with I<sup>2</sup>
| Outcomes | Mean | Std Err | likelihood ratio | p-value | I^2 |
|---|---|---|---|---|---|
| Vote Share Per Protester | 11.95 | 4.00 | 87.1 | 0.003 | 3% |
| Vote Share | 1.59 | 0.48 | 257 | 0.001 | 45% |
| Vote Share (Rain Only) | 1.14 | 0.42 | 39.3 | 0.007 | 0% |
| Single Hypothesis | 1.06 | 0.78 | 2.55 | 0.172 | 74% |
| Favorability | 2.68 | 2.32 | 1.95 | 0.249 | 72% |
Table A.2 reports summary statistics for the same pooled outcomes as Table 3, plus additional outcomes from Klein Teeselink & Melios (2021)[12:3] that I excluded from the main table. Consider this like a leave-one-out analysis, except instead it's a put-one-in analysis.
- "Vote Share Per Protester" adds BLM vote share per protester (mean 3.3, std err 0.6, n = 3053; from Table 2).
- The middle three rows add BLM vote share.
- "Favorability" adds survey agreement rate for the statement "Blacks should not receive special favors."
Table A.2: Pooled Outcomes Including BLM
| Outcomes | Mean | Std Err | likelihood ratio | p-value | I^2 | P(negative effect) |
|---|---|---|---|---|---|---|
| Vote Share Per Protester | 7.89 | 3.91 | 7.62 | 0.044 | 65% | 0.072 |
| Vote Share | 1.71 | 0.43 | 2.84e+03 | 0.001 | 33% | 0 |
| Vote Share (Rain Only) | 1.32 | 0.41 | 192 | 0.002 | 3% | 0 |
| Single Hypothesis | 1.36 | 0.68 | 7.6 | 0.045 | 69% | 0.123 |
| Favorability | 2.66 | 1.99 | 2.44 | 0.182 | 48% | 0.136 |
Table A.3 uses the same row definitions as in Table A.2, while also correcting for publication bias by creating dummy null outcomes as described above.
Table A.3: Pooled Outcomes Including BLM, Adjusted for Publication Bias
| Outcomes | Mean | Std Err | likelihood ratio | p-value |
|---|---|---|---|---|
| Vote Share Per Protester | 2.79 | 1.55 | 5 | 0.073 |
| Vote Share | 0.88 | 0.38 | 14.9 | 0.021 |
| Vote Share (Rain Only) | 0.70 | 0.36 | 6.69 | 0.052 |
| Favorability | 0.66 | 0.51 | 2.26 | 0.203 |
The BLM study found a smaller mean effect than the other studies, but it also had a high t-stat. Adding BLM to the pooled outcomes decreases means but does not consistently decrease the strength of evidence.
As discussed previously, the BLM study isolates local effects of protests, which is undesirable—it ignores any non-local effects that protests might have. Luckily, the study also reports results with no adjustment for spatial autocorrelation (in its Table A3).
In general, it's not a good idea to ignore spatial autocorrelation because it may overstate the strength of evidence. But for the "vote share per protester" metric, the un-adjusted outcome had a lower t-stat than the adjusted outcome. So I think it's fair to add the un-adjusted result to the pooled sample.
Here are the results for pooled vote share per protester, using the BLM outcome with no adjustment to spatial autocorrelation.
Table A.4: Pooled Outcomes for Vote Share Per Protester, Including BLM
| Outcomes | Mean | Std Err | likelihood ratio | p-value | P(negative effect) |
|---|---|---|---|---|---|
| no correction | 11.89 | 2.32 | 4.83e5 | 4e-7 | 0 |
| corrected for publication bias | 6.23 | 3.05 | 8.1 | 0.041 | 0.138 |
My meta-analysis compared standardized outcomes (using the method described in Gelman (2007)[24:1]). Table A.5 shows the results from pooling unstandardized outcomes instead (excluding BLM).
Table A.5: Unstandardized Pooled Outcomes
| Outcomes | Mean | Std Err | likelihood ratio | p-value | P(negative effect) |
|---|---|---|---|---|---|
| Vote Share Per Protester | 11.95 | 4.00 | 87.1 | 0.003 | 0 |
| Vote Share | 3.31 | 1.37 | 18.1 | 0.017 | 0.04 |
| Vote Share (Rain Only) | 1.94 | 1.02 | 6.13 | 0.057 | 0.011 |
| Single Hypothesis | 1.66 | 1.77 | 1.55 | 0.349 | 0.293 |
| Favorability | 5.20 | 1.84 | 53.8 | 0.005 | 0 |
Appendix B: Methodological revisions
In the interest of transparency—and because I didn't pre-register a methodology—here is a list of non-trivial revisions I made in the process of writing this article. In chronological order:
- Originally, I used a different method for estimating the effect of publication bias. Instead of creating dummy null clones as described above, I created
knull dummies (one for each real outcome) that were all identical, and that took their standard error as the average of the real studies' standard errors. This method produced lower p-values. However, I decided it was too unrealistic to give all three null dummies the exact same summary statistics. - For BLM and Women's March results, I originally used the primary outcomes as reported by their respective papers. I revised my meta-analysis to use the weakest outcomes (lowest t-stat) from the robustness checks, to more conservatively account for spatial autocorrelation.
- I originally included BLM outcomes in the meta-analysis. Upon re-reading the BLM paper, I realized it failed its placebo tests, so I removed it. Appendix A shows the results when including BLM.
- I went back to using the main outcome for BLM instead of a robustness check outcome because it's simpler, and I wasn't including BLM in the main meta-analysis anyway. This slightly strengthened the reported results in Appendix A.
- Originally, my meta-analysis used unstandardized means. I wanted to use standardized means but I wasn't sure how to standardize them. Eventually, I found Gelman (2007)[24:2] and used its method for standardizing outcomes. This increased most results' t-stats because it decreased between-study variance. (However, it decreased the Favorability t-stat.) Unstandardized pooled outcomes are reported in Table A.5.
- Initially, I wanted to scale all binary outcomes by their standard deviations, but I did not have the necessary data to calculate all standard deviations, so I simply left them unscaled.
Appendix C: Comparing the strength of evidence to saturated fat research
To get some perspective on the strength of evidence on protests, I would like to compare it to a thorny question in an unrelated field that I reviewed recently.
Last year I examined the evidence on whether saturated fat is unhealthy, primarily focusing on a Cochrane review[35] of RCTs. I ultimately decided I was 85% confident that saturated fat is unhealthy.
How does the evidence on protest effectiveness compare to the evidence on saturated fat?
Both hypotheses face similar problems: there are many observational studies that support the hypothesis, but few experiments. (In the case of protests, there are no (real-world) experiments, but there are some natural experiments.)
The Cochrane review included 15 RCTs. My review included five natural experiments.
The studies in the Cochrane review were true experiments. The protests studies were not true experiments, which means they can't establish causality quite as firmly.
The Cochrane review found no evidence of publication bias (Figure 3). There aren't enough protest quasi-experiments to test for publication bias, but I did test what would happen if I added in some hypothetical null-result studies.
Three individual studies on saturated fat had statistically significant positive effects, six had non-significant positive effects, and four had non-significant negative effects. (Two studies did not report data on cardiovascular events.)
In my review, three out of three studies (or four out of four[36]) found statistically significant positive effects for nonviolent protests, and one study found statistically significant negative effects for violent protests.
When pooling all RCTs together, the Cochrane review found a marginally statistically significant effect of saturated fat reduction on cardiovascular events (95% CI [0.70, 0.98] where 1 = no effect). It also found significant effects on short-term health outcomes like weight and cholesterol. It found positive but non-significant results on mortality outcomes (including all-cause mortality and cardiovascular mortality).
In my meta-analysis, most of my pooled samples had strong positive results. My primary metric had p < 0.003; the Cochrane review didn't find any primary results that strong.
Even though the Cochrane review included three times as many studies, I think the evidence on protest outcomes is stronger:
- The saturated fat RCTs got mixed results, but the three or four studies on nonviolent protests all pointed the same direction.
- (Most of) the pooled outcomes for protests had moderate to strong p-values. The pooled outcomes for saturated fat reduction had moderate p-values at best.
On the other hand, the protest studies have to deal with the spatial autocorrelation problem, and it's not entirely clear that they succeeded at establishing causation. The saturated fat studies were experiments; they had no analogous problem.
The smaller number of studies also means the protests meta-analysis is more vulnerable to errors in any one study.
It's a judgment call as to whether you think the weaker methodology for protest studies outweighs the stronger likelihood ratios. I'm inclined to say it doesn't.
Ozden, J., & Glover, S. (2022). Literature Review: Protest Outcomes. ↩︎
Ozden, J., & Glover, S. (2022). Protest movements: How effective are they? ↩︎
Orazani, N., Tabri, N., Wohl, M. J. A., & Leidner, B. (2021). Social movement strategy (nonviolent vs. violent) and the garnering of third-party support: A meta-analysis. ↩︎ ↩︎ ↩︎ ↩︎
ChatGPT Deep Research was useful for finding and summarizing studies, but not for assessing their quality. When I asked ChatGPT to only include methodologically rigorous studies in the review, it didn't appear to change which studies it included, it just rationalized why every study was rigorous. It said things like (paraphrasing) "we know this observational study's findings are robust because it controlled for confounders" and "because it had a large sample size" (??). ↩︎
McVeigh, R., Cunningham, D., & Farrell, J. (2014). Political Polarization as a Social Movement Outcome. ↩︎ ↩︎ ↩︎
Bremer, B., Hutter, S., & Kriesi, H. (2020). Dynamics of protest and electoral politics in the Great Recession. ↩︎ ↩︎ ↩︎
Hungerman, D., & Moorthy, V. (2023). Every Day Is Earth Day: Evidence on the Long-Term Impact of Environmental Activism. doi: 10.1257/app.20210045 ↩︎ ↩︎ ↩︎
Mellon, J. (2024). Rain, rain, go away: 194 potential exclusion-restriction violations for studies using weather as an instrumental variable. ↩︎
Sarsons, H. (2015). Rainfall and conflict: A cautionary tale. ↩︎
Madestam, A., Shoag, D., Veuger, S., & Yanagizawa-Drott, D. (2013). Do Political Protests Matter? Evidence from the Tea Party Movement. ↩︎ ↩︎ ↩︎
Wasow, O. (2020). Agenda Seeding: How 1960s Black Protests Moved Elites, Public Opinion and Voting.. ↩︎ ↩︎ ↩︎ ↩︎
Klein Teeselink, B., & Melios, G. (2021). Weather to Protest: The Effect of Black Lives Matter Protests on the 2020 Presidential Election. ↩︎ ↩︎ ↩︎ ↩︎
Larreboure, M., & Gonzalez, F. (2021). The Impact of the Women’s March on the U.S. House Election. ↩︎ ↩︎ ↩︎ ↩︎
Braemer et al. (2020) found a non-significant result and then did some subgroup analysis and got a significant result. I find that suspicious but I didn't bother to look deeper because it's an observational study anyway. ↩︎
The paper did not report the p-value, but it did report the standard error, so I calculated the p-value from that. ↩︎
Collins, W. J., & Margo, R. A. (2007). The Economic Aftermath of the 1960s Riots in American Cities: Evidence from Property Values. ↩︎
Beck, N., Gleditsch, K. S., & Beardsley, K. (2006). Space Is More than Geography: Using Spatial Econometrics in the Study of Political Economy. ↩︎
If it were true, we'd expect to see a similar phenomenon in the placebo tests of Madestam et al. (2013) and Hungerman & Moorthy (2023), but we don't. ↩︎
Belloni, A., Chernozhukov, V., & Hansen, C. (2010). LASSO Methods for Gaussian Instrumental Variables Models. ↩︎
Conley, T. G. (1999). GMM estimation with cross sectional dependence.. ↩︎
I emailed the corresponding author to ask about this apparent discrepancy and did not receive a reply. ↩︎
Hungerman & Moorthy (2023) did provide enough information to estimate the change in Earth Day favorability per protester, by dividing change in favorability by change in number of protesters from the paper's Table 4. However, this estimate would have high variance on the denominator, which makes the result unreliable. ↩︎
Favorability (1) measured public support for environmentalism as the percentage of respondents answering Yes to "we're spending too little money" on protecting the environment. ↩︎ ↩︎ ↩︎ ↩︎ ↩︎ ↩︎
Gelman, A. (2007). Scaling regression inputs by dividing by two standard deviations. ↩︎ ↩︎ ↩︎
Some additional detail:
Gelman (2007) proposes scaling continuous variables by 2 standard deviations because this puts them onto the same scale as a binary variable where the control and treatment groups have the same size. If you have a sample of binary outcomes where 50% of the outcomes are 0 ("no rain") and 50% are 1 ("rain"), then the standard deviation is 0.5. If the probabilities are not 50/50 then the standard deviation will not equal 0.5. (For example, the Tea Party rainfall variable had a standard deviation of 0.401.) Arguably it would make sense to scale all binary variables to a standard deviation of 0.5. However, I did not do this because I didn't have the necessary data for all the papers. Instead, I left all binary variables unscaled. (Gelman (2007) discusses whether probability-skewed binary variables should be scaled, but ultimately does not take a stance.)
The Earth Day paper directly regressed outcomes onto a continuous rainfall variable (without doing a two-stage regression). I scaled the reported slopes by 2 times the standard deviation of rainfall.
The Women's March paper reported values scaled to 1 standard deviation, so I divided them by 2.
The Tea Party, BLM, and Civil Rights papers reported effects in binary terms, so I did not scale them. ↩︎ ↩︎
Even if I replace the relatively weak Earth Day favorability outcome with Earth Day favorability among under-20s (which had a likelihood ratio of 37), the pooled likelihood ratio is still only 3.43. ↩︎
Defined as the number of Congress members who voted in line with conservative positions according to the American Conservative Union. ↩︎
Defined as alignment with Tea Party positions, measured in standard deviations. ↩︎
Evaluated on a 5-point scale from "strongly disagree" to "strongly agree". ↩︎ ↩︎
The linked webinar is the least-bad explanation of Egger's test that I could find, but it doesn't explain it very well so I will attempt to explain:
In the presence of publication bias, more powerful studies will have lower means. the small low-mean studies don't get published. Therefore there will be a negative correlation between a study's power and its mean. (I measured power as the inverse standard error but you could also use the inverse variance or the sample size.)
So you test for publication bias by doing a linear regression of study means on study power.
- If the regression has a correlation close to zero, that indicates no publication bias.
- If there is a significant correlation, that's evidence of publication bias.
Lest this footnote give the impression that I know what I'm talking about, I didn't even know what Egger's regression test was until I wrote this. My process was that I asked Claude what statistical test I could use to check for publication bias, it suggested Egger's test and then gave an obviously-incorrect explanation of how the test works, and then I read several barely-comprehensible articles about the test until I thought I understood it. ↩︎
I could do full replications for the papers that published their data, but that would be considerably more work for a low chance of paying off. ↩︎
In my experience, I always update tables if I make revisions to my calculations, but it's hard to keep track of everywhere in the text that I referenced a number. ↩︎
Technically, one of them did look at media coverage, but not using the rainfall method. ↩︎
I'm thinking about the strength of evidence from a sociology perspective. Getting good evidence in sociology is hard. ↩︎
Hooper, L., Martin, N., Jimoh, O. F., Kirk, C., Foster, E., & Abdelhamid, A. S. (2020). Reduction in saturated fat intake for cardiovascular disease. ↩︎
Three if you exclude the BLM study due to its failed placebo tests; four if you include it. ↩︎
I have to admit, I wouldn't have taken it to heart much if these studies hadn't found much effect (nor if they had found a huge effect). And I feel exposed here bc I know that looks bad, like I'm resisting actual evidence in favor of my vibes, but I really think my model is better and the evidence in these studies should only tweak it.
I'm just not that hopeful that you can control enough of the variables with the few historical examples we have to really know that through this kind of analysis. I also think the defining of aims and impacts is too narrow-- Overton window pushing can manifest in many, many ways and still be contributing to the desired solution.
I'm comfortable with pursuing protests through PauseAI US because they were a missing mood in the AI Safety discussion. They are a form of discussion and persuasion, and I approach them similarly to how I decide to address AI danger in writing or in interviews. They are also a form of showing up in force for the cause, in a way that genuinely signals commitment bc it is very hard to get people to do it, which is important to movement building even when small. The only point of protests is not to get whatever the theme of that protest was (the theme of our protests is either shutting down your company or getting an international treaty lol)-- they feed back into the whole movement and community, which can have many unanticipated but directionally desirable impacts.
I don't think my approach to protests is perfect by any means, and I may have emphasized them too much and failed to do things I should to grow them. But I make my calls about doing protests based on many considerations for how it will affect the rhetorical and emotional environment of the space. I wish there were studies that could tell me how to do this better, but there aren't, just like there aren't studies that tell me exactly what to write to change people's minds on AI danger in the right way. (Actually, a good comparison here would be "does persuasive writing work?" bc there we all have personal experiences of knowing it worked, but actually as a whole the evidence might be thin for it achieving its aims.)
Interesting write up! Thanks for producing it. If effective altruism is going to do more political interventions we should also have a good evidence based understanding of what works and why.
Speaking of the why.. do we know what the mechanism is for the effectiveness of protests? I can imagine a few possibilities.
I assume the reality is far more complicated than these ideas above, and probably somewhat unknowable. But, what do we know?
I don't know much about the mechanisms, but based on the evidence I reviewed, I can say a few things:
Edit: Social Change Lab also has a review on what types of protests are most effective. I haven't reviewed the evidence in detail but my sense is it's mostly weak; still better than no evidence.
Executive summary: A critical review of the evidence suggests that nonviolent protests likely work to influence electoral outcomes and public opinion in the U.S., based on natural experiments, although the generalizability of results is uncertain and the strength of evidence is somewhat overstated in the Social Change Lab’s report.
Key points:
This comment was auto-generated by the EA Forum Team. Feel free to point out issues with this summary by replying to the comment, and contact us if you have feedback.
Thank you for writing this, I found it very useful.
You mention that all the studies you looked at involved national protests. So is it fair to say that the takeaway is that we have pretty strong evidence for the efficacy of very large protests in the US, but very little evidence about smaller protest activities?
Another consistency is that all the protests were on issues affecting humans. I wonder if protests about animals can expect to have similar results, given that baseline consideration for animals as relevant stakeholders seems to be quite a bit lower.
Finally, just musing, but I wonder if any studies have looked at patterns of backlash? E.g., BLM protest succeeds in the short term, but then DEI is cancelled by the Trump administration. I suppose there could be backlash to any policy success regardless of how it was accomplished, but one hypothesis could be that protest is a particularly public form of moving your movement forward, and so perhaps particularly likely to draw opposition -- although why you would see that years later instead of immediately is not clear, and so maybe this isn't a very good hypothesis...
I think that's correct. On priors, if large-scale protests work, I would expect smaller protests to work too, but there's minimal supporting evidence. In this section I gave an argument for why small-scale protests might not work even if nationwide protests do.
I don't know, but there's some evidence about this. Orazani et al. (2021) included some animal welfare protests. It would be possible to do a subgroup analysis comparing the animal vs. human protests.
There are indeed studies on this, but I didn't review them because none of them are high-quality. Well, Wasow (2020) has high-quality evidence that violent protests backlash, but I think that's not what you're talking about; you're talking about a short-term success followed by a long-term backlash.
Survey evidence from the BLM study actually found the reverse order: protests appeared to have a negative effect on BLM favorability in the weeks following the protests, but by the time of the 2020 election, BLM appeared to have a net positive effect—although I don't think the study succeeded at establishing causality, so I'm not confident that this is a real effect.
Here's an example of what I would consider high-quality evidence on this question:
There are no studies like that, as far as I know.